Quiz · Easy
Practice the data questions from SAT, ACT and intro statistics: bar charts, box plots, pie charts and scatter plots.
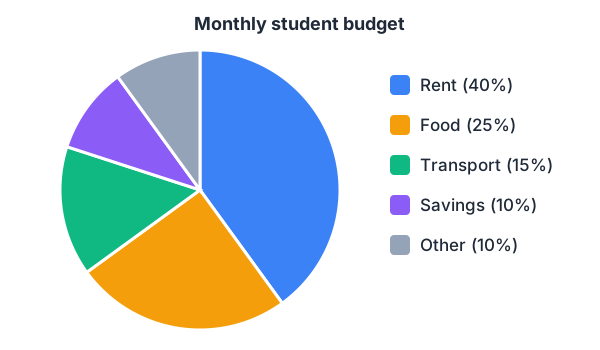
A student's income is $2,000 a month. How much goes to food?
$250
$400
$500
$800
25% of $2,000 = $500.
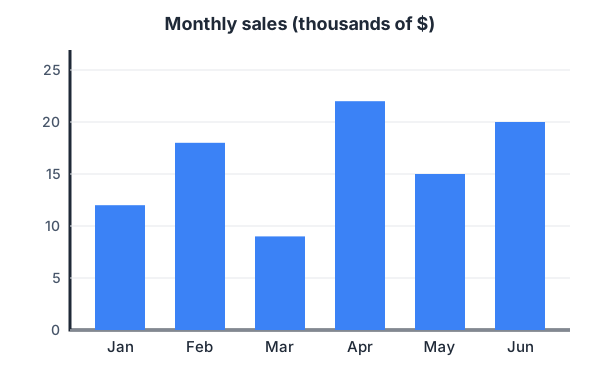
In which month were sales highest?
February
April
June
May
April's bar is the tallest, at $22k.
How much higher were April's sales than March's?
$9k
$11k
$13k
$22k
22 − 9 = 13, so $13k.
What was the mean monthly sales figure from January to June?
$15k
$16k
$17k
$18k
(12 + 18 + 9 + 22 + 15 + 20) / 6 = 96 / 6 = 16, so $16k.
In how many months were sales above $15k?
2
3
4
5
February (18), April (22) and June (20). May is exactly 15, which is not above 15.
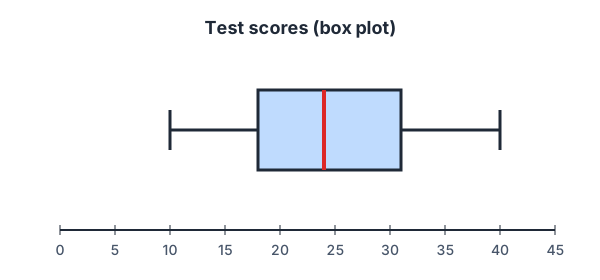
What is the median test score?
18
24
25
31
The line inside the box marks the median: 24.
What is the interquartile range (IQR)?
13
30
7
24
IQR = Q3 − Q1 = 31 − 18 = 13. 30 is the range (40 − 10).
About what percentage of students scored above 31?
50%
75%
25%
10%
31 is Q3; a quarter of the data lies above the third quartile.
What fraction of the budget is rent?
40% = 40/100 = 2/5.
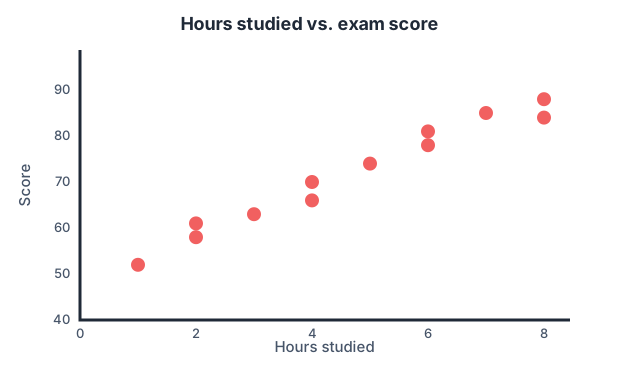
Which statement best describes the relationship shown?
Strong negative correlation
No correlation
Strong positive correlation
Studying causes higher scores
Points rise from left to right in a tight band: a strong positive correlation. Correlation alone cannot prove causation.
Using the trend, which score is most likely for a student who studied 5 hours?
55
62
74
90
The point at 5 hours sits at 74, right on the trend.
