Quiz · Medium
Empirical rule, standardizing, z-table probabilities, sampling distributions, the central limit theorem and the t distribution.
What are the mean and standard deviation of the standard normal distribution?
1 and 0
0 and 1
0 and 0
1 and 1
The standard normal is N(0, 1).
Which percent of a normal distribution lies within one standard deviation of the mean?
About 68%
About 50%
About 95%
About 34%
The empirical rule: 68% within 1 sd. 34% is one side only.
Exam scores are N(75, 8). What is the z-score of a score of 91?
1.5
16
0.5
2
(91 - 75)/8 = 2.
Heights are N(170, 10). About what percent exceed 190 cm?
5%
16%
2.5%
0.3%
190 is z = 2, and about 2.5% of the area lies beyond +2 sd.
Heights are N(170, 10). What is P(X > 185) approximately?
0.933
0.067
0.15
0.50
z = 1.5; the upper-tail area is 1 - 0.9332 = 0.0668.
What z-value has 2.5% of the standard normal in the upper tail?
1.96
1.64
2.33
2.58
The 97.5th percentile is z = 1.96, which gives the 95% middle interval.
For a normal distribution, which statement is correct?
P(X = a) is the height of the curve
P(X = a) = 0.5 at the mean
P(X = a) = 1/sigma
P(X = a) = 0 for any single value a
A single point has no area under a continuous density.
The sampling distribution of x-bar has what standard deviation when the population sd is sigma and the sample size is n?
sigma / n
sigma x sqrt(n)
sigma / sqrt(n)
sigma^2 / n
The standard error of the mean is sigma/sqrt(n).
A population has sd 20. For samples of n = 100, the standard error of x-bar is...
0.2
2
20
10
20/sqrt(100) = 2.
What does the Central Limit Theorem say?
For large n, the sampling distribution of x-bar is approximately normal regardless of the population shape
Large samples make the population normal
The sample mean always equals the population mean
The sample standard deviation equals sigma for n > 30
The CLT is about the distribution of sample means, not of the data.
If the sample size is multiplied by 9, the standard error of the mean is...
Divided by 9
Multiplied by 3
Unchanged
Divided by 3
SE is proportional to 1/sqrt(n), and sqrt(9) = 3.
For p = 0.5 and n = 100, the standard deviation of the sample proportion is...
0.5
0.25
0.05
0.005
sqrt(0.5 x 0.5 / 100) = 0.05.
Which condition lets you use a normal model for the sampling distribution of p-hat?
n < 30
np >= 10 and n(1-p) >= 10
p = 0.5
n > 10% of the population
Both expected successes and failures need to be at least 10.
Compared with the standard normal, the t distribution has...
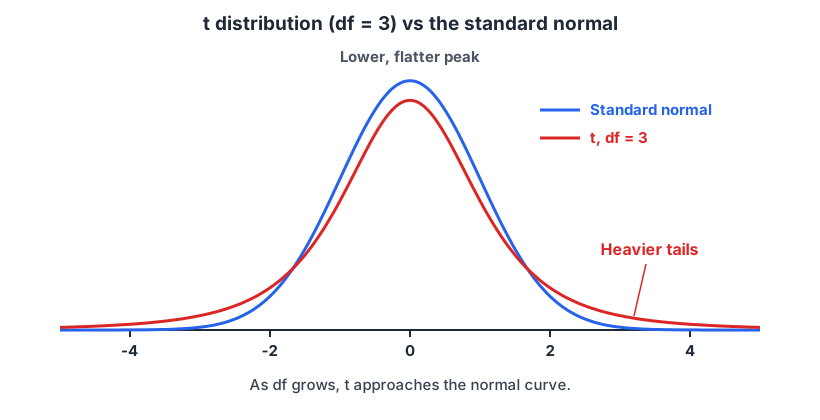
Heavier tails and a lower peak
Lighter tails and a higher peak
The same shape
A mean of 1
Extra uncertainty from estimating sigma gives heavier tails.
As the degrees of freedom for a t distribution increase, it...
Becomes right-skewed
Becomes more spread out
Becomes uniform
Approaches the standard normal distribution
For large df, t is almost identical to z.
The curve shown has about 95% of its area between which values?
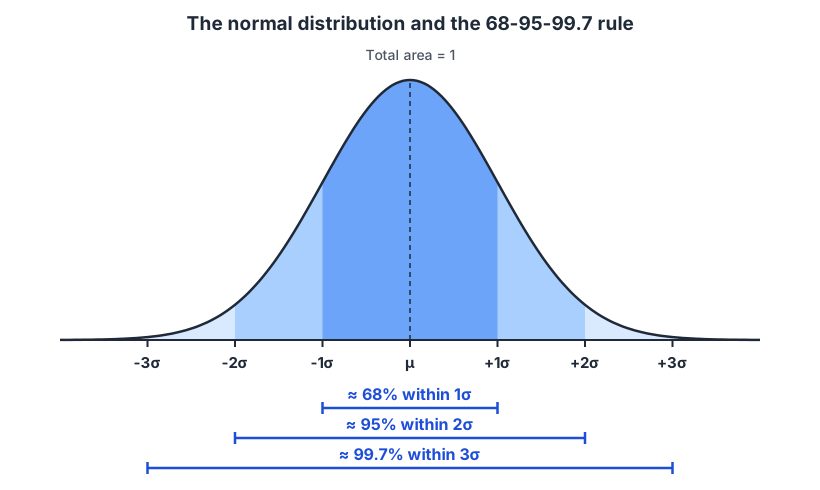
mu - sigma and mu + sigma
mu - 3 sigma and mu + 3 sigma
mu - 2 sigma and mu + 2 sigma
mu and mu + 2 sigma
The 95% bracket in the diagram spans -2σ to +2σ.
Which distribution is right-skewed and takes only nonnegative values?
Standard normal
Chi-square
t
Uniform on [-1, 1]
Chi-square values are sums of squares, so they are nonnegative, with a long right tail.
X ~ N(100, 15) and Y ~ N(80, 8) are independent. What is the standard deviation of X - Y?
17
7
23
289
sqrt(15^2 + 8^2) = sqrt(289) = 17.
Scores are N(70, 12). For samples of 36, P(x-bar > 73) is closest to...
0.40
0.31
0.93
0.07
SE = 2, z = 1.5, upper-tail probability 0.0668.
Why does the sample mean become less variable as n increases?
Larger samples remove bias from poor sampling methods
The population sd shrinks
Averaging more observations cancels out more random variation
The mean of the population changes
SE = sigma/sqrt(n) decreases, but bias from a bad design would remain.
