Quiz · Medium
Quiz on inventory costs, EOQ, reorder point, safety stock, ABC analysis, inventory turnover and costing methods.
A firm's annual demand is 4,800 units, ordering cost is $50 per order and holding cost is $6 per unit per year. What is the EOQ?
400 units
800 units
283 units
141 units
EOQ = sqrt(2 x 4800 x 50 / 6) = sqrt(80,000) = 283. Mixing up the formula by forgetting the square root gives results like 800.
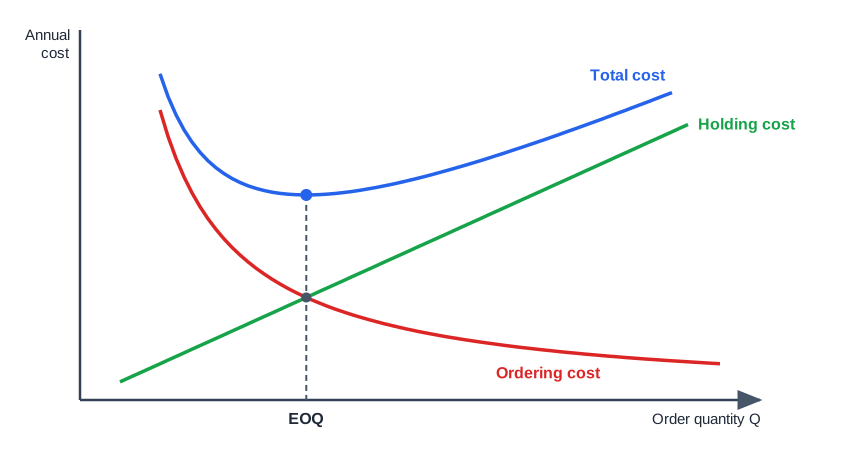
In the EOQ model, at the optimal order quantity
annual ordering cost equals annual holding cost
ordering cost is zero
holding cost is zero
total cost equals purchase cost
The total cost curve is lowest where the rising holding curve crosses the falling ordering curve.
Which change would reduce the EOQ?
A rise in annual demand
A fall in holding cost per unit
A longer supplier lead time
A drop in ordering cost per order
EOQ = sqrt(2DS/H). Lower S lowers EOQ; higher D raises it; lower H raises it; lead time does not appear in EOQ.
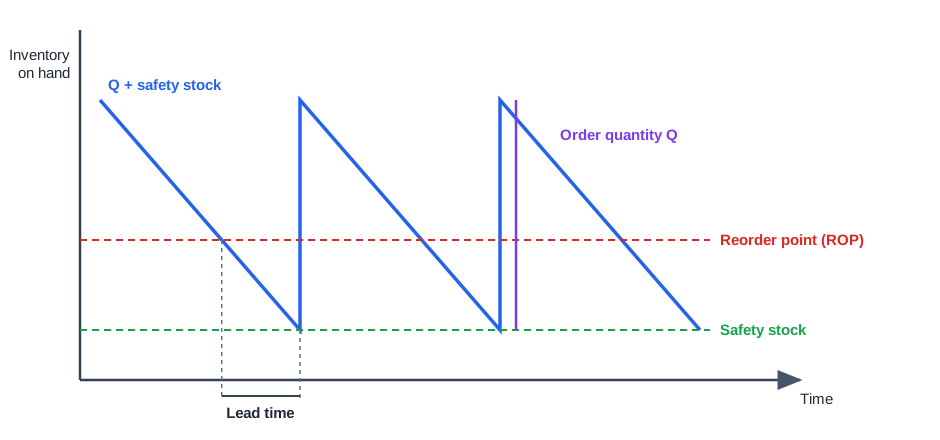
In the diagram, which quantity is labeled by the purple line that jumps at each delivery?
Safety stock
Order quantity Q
Reorder point
Lead time
The jump in inventory when the order arrives equals the order quantity. Safety stock is the floor, and the reorder point is the trigger level.
In the inventory diagram, an order is placed when stock reaches the
safety stock level
reorder point
maximum stock level
zero stock level
A continuous review system places an order when inventory position reaches the ROP. The order then arrives after the lead time, when stock is down at the safety stock level.
Daily demand is 30 units, lead time is 5 days and safety stock is 40 units. What is the reorder point?
150
40
110
190
ROP = 30 x 5 + 40 = 190. Forgetting safety stock gives 150.
Demand has a standard deviation of 12 units per day, lead time is 4 days and the target is a 95% cycle service level (z = 1.65). Safety stock is about
40 units
20 units
79 units
48 units
SS = 1.65 x 12 x sqrt(4) = 39.6. Forgetting the square root of lead time gives 79 when using L=4 directly (1.65 x 12 x 4).
Which statement about ABC analysis is correct?
A items are the cheapest items
C items need the tightest control
A items are a small share of SKUs but a large share of usage value
Classification is based on item weight
ABC ranks items by annual usage value (price x volume). It is based on value, not weight or unit price alone.
Under rising prices, compared with FIFO, LIFO gives
lower cost of goods sold and higher profit
the same profit
higher cost of goods sold and lower reported profit
lower inventory costs on the income statement
LIFO charges the latest, higher costs to COGS first. It is not allowed under IFRS.
A firm has COGS of $900,000 and average inventory of $150,000. What is its inventory turnover and days of inventory?
6 times, about 61 days
6 times, about 6 days
0.17 times, about 61 days
150 times, about 2 days
Turnover = 900,000 / 150,000 = 6. DIO = 365 / 6 = about 61 days.
In the EOQ model, doubling annual demand doubles the EOQ.
True
False
EOQ is proportional to the square root of D, so doubling demand raises EOQ by about 41%.
A periodic review system typically needs more safety stock than a continuous review system because
it uses larger order quantities
lead times are longer
demand is less variable
protection must cover lead time plus the review interval
Between reviews you cannot react to a fall in stock, so uncertainty over a longer period must be covered.
A newsvendor has price $15, unit cost $9 and salvage value $3. What critical ratio determines the optimal stocking level?
0.67
0.50
0.40
0.60
Cu = 15 - 9 = 6; Co = 9 - 3 = 6; CR = 6 / 12 = 0.5.
The graph shows three cost curves. Which curve is the straight rising line?
Ordering cost
Holding cost
Total cost
Stockout cost
Holding cost = (Q/2)H, which is linear in Q. Ordering cost falls as Q grows, and the total cost curve is U-shaped.
What is the main reason consolidating regional warehouses into one central stock location can reduce inventory?
Holding cost per unit is always lower
Lead times become zero
EOQ falls to zero
Risk pooling lowers relative demand variability, so less safety stock is needed
Pooling demand reduces variability; safety stock grows with the square root of locations. Central stock can lengthen delivery time, which is the trade-off.
Vendor-managed inventory means that
the supplier decides replenishment quantities using the customer's stock data
the customer owns all stock until sold
the supplier pays for holding the customer's warehouse
orders are placed only once a year
VMI shifts the replenishment decision to the supplier. Consignment is when the supplier still owns the stock; the two can be combined.
D = 10,000 units, Q = 500, S = $25, H = $4. Total annual ordering plus holding cost is
$1,000
$1,250
$1,500
$3,000
Ordering = (10,000/500) x 25 = $500. Holding = (500/2) x 4 = $1,000. Total $1,500.
Which situation makes JIT-style small lots most suitable?
High setup cost and unreliable suppliers
Highly uncertain long supplier lead times
Very low setup/ordering cost and reliable nearby suppliers
Items with large quantity discounts only
Lower S makes the EOQ small, and JIT requires dependable, short lead times.
A firm orders 1.2 times the EOQ. Compared with the minimum cost, total ordering plus holding cost is about
1.7% higher
20% higher
10% higher
unchanged
Ratio = 0.5(1.2 + 1/1.2) = 0.5(1.2 + 0.833) = 1.017. The curve is flat near the optimum, so a 20% error costs under 2%.
A company has 100 on-hand, 200 on order and 20 backordered. Its inventory position is
300
100
320
280
Inventory position = on hand + on order - backorders = 100 + 200 - 20 = 280.
