Quiz · Hard
Eighteen harder questions on the rule of 70, the Solow model, Okun's law, AD-AS shocks, output gaps and growth accounting.
A country's real GDP grows at 3.5% per year. Using the rule of 70, about how long until it doubles?
35 years
20 years
14 years
7 years
70 ÷ 3.5 = 20. Dividing by 2 (35 years) would be the answer for 2% growth; 14 years is for 5%.
In the Solow model, a permanent increase in the saving rate leads to:
A permanently higher growth rate of output per worker
A lower capital stock per worker
A higher steady-state level of output per worker, but the same long-run growth rate
No change in output per worker at all
Higher saving raises capital per worker and output per worker until diminishing returns bring the economy to a new, higher steady state. Long-run growth of output per worker is driven by technology, not saving.
The scatter plot shows quarterly GDP growth against quarterly change in the unemployment rate. What relationship does it illustrate?
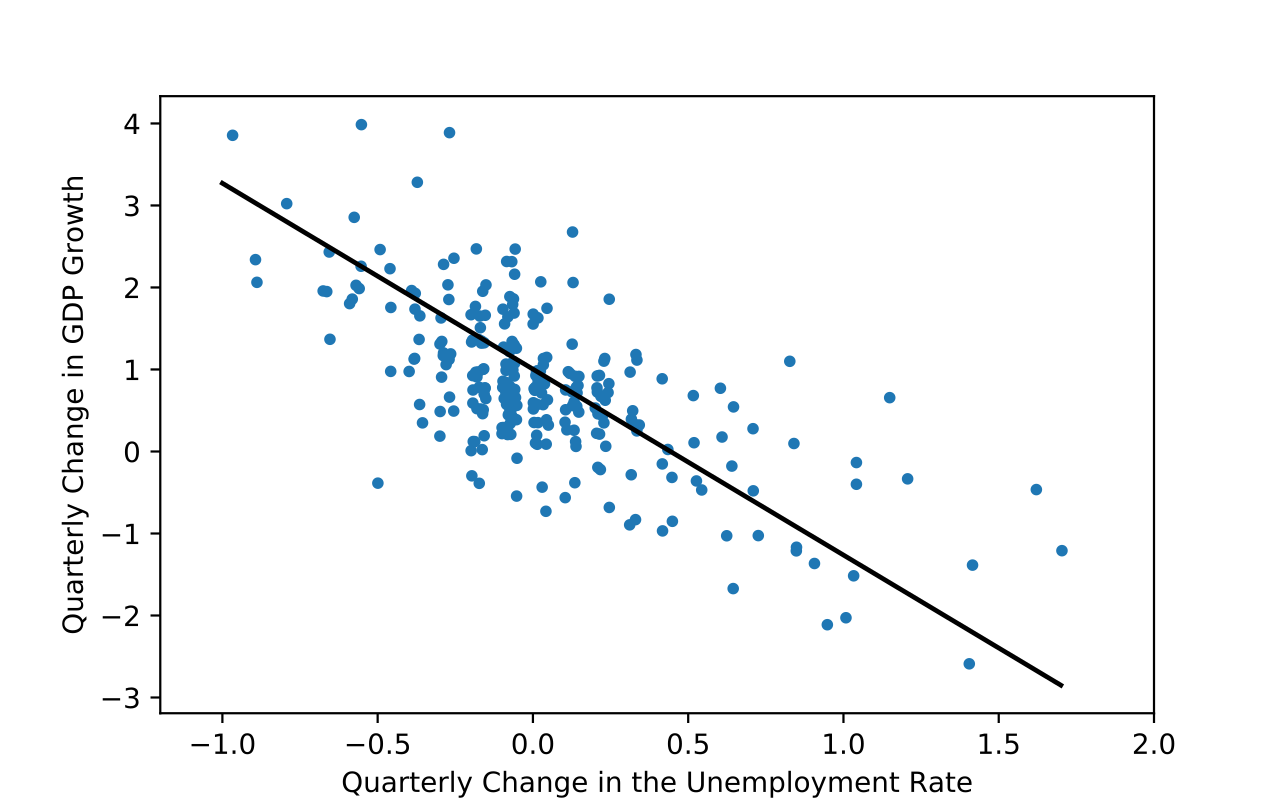
Okun's law: faster growth goes with falling unemployment
The Phillips curve: unemployment and inflation trade off
The Laffer curve: tax rates and revenue
The Beveridge curve: vacancies and unemployment
The downward-sloping fit shows GDP growth rises when unemployment falls: Okun's law. The other axes in those curves are inflation, tax revenue or vacancies. Image: Acheck10, CC BY-SA 4.0, via Wikimedia Commons.
A sudden rise in oil prices raises costs for all firms. In the short run, AD-AS predicts:
Real GDP rises and the price level rises
Real GDP falls and the price level rises
Real GDP falls and the price level falls
Real GDP and the price level both stay unchanged
Higher input costs shift SRAS left, giving stagflation. A fall in both output and prices would signal a demand shock instead.
A collapse in house prices makes households feel poorer. What happens in the short run?
AD shifts right: real GDP and the price level both rise
SRAS shifts left: real GDP falls, the price level rises
AD shifts left: real GDP and the price level both fall
LRAS shifts left: potential output falls permanently
Lower wealth reduces consumption, shifting AD left along the upward-sloping SRAS. Output and prices fall. Housing wealth is a demand factor, not a change in productive capacity.
The economy is in a recessionary gap and the government does nothing. According to the classical self-correction view, what happens?
Wages rise, SRAS shifts left and the price level rises
Wages fall, SRAS shifts right and output returns to potential at a lower price level
AD shifts right on its own and prices rise
LRAS shifts right and potential output rises
High unemployment pushes wages down, lowering costs and shifting SRAS right. Keynesians worry this is slow because wages are sticky.
Which of these is a lagging indicator of the business cycle?
The unemployment rate
Building permits
Stock market prices
New orders for durable goods
The unemployment rate typically peaks after a recession ends. Building permits, stock prices and new orders tend to turn before the economy does.
Which variable is countercyclical?
Unemployment insurance payments
Business investment
Corporate profits
Payroll employment
Unemployment benefits rise when the economy weakens. Investment, profits and employment all move with the cycle (procyclical).
Potential GDP is $20,000 billion and actual GDP is $19,000 billion. The economy has:
An inflationary gap of 5% of potential output
A recessionary gap of 1%
A recessionary gap of 5% of potential output
No gap: the economy is in long-run equilibrium
(19,000 − 20,000) ÷ 20,000 = −5%. Below-potential output is a recessionary gap, with unemployment above the natural rate.
Output grows 4%, capital grows 3%, labor grows 1%, and capital's income share is 1/3. Growth accounting implies TFP growth of about:
1.0%
2.3%
3.0%
4.0%
TFP growth = 4 − (1/3)(3) − (2/3)(1) = 4 − 1 − 0.67 ≈ 2.3%. Subtracting only capital's 3% would ignore the shares.
Which event shifts the long-run aggregate supply curve to the right?
Discovery of a technology that raises productivity
A tax cut that raises consumer spending
An increase in the money supply
A rise in consumer confidence
LRAS depends on productive capacity: technology, capital, labor and institutions. The other options shift AD.
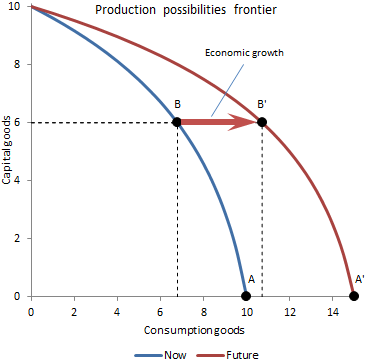
The shift of the production possibilities frontier from 'Now' to 'Future' represents:
A movement along the PPF
Economic growth
Unemployment of resources
A change in opportunity cost along one curve
An outward shift means more of both goods are attainable, caused by more capital or better technology. Image: BoH, CC BY-SA 4.0, via Wikimedia Commons.
True or False: The NBER defines a recession as two consecutive quarters of negative real GDP growth.
True
False
False. Two negative quarters is a popular rule of thumb. The NBER defines a recession as a significant decline in economic activity across the economy lasting more than a few months, judged using several indicators.
Nominal GDP grows 3% while the price level rises 5%. Real GDP:
Falls by about 2%
Rises by about 2%
Rises by about 8%
Is unchanged
Real growth ≈ nominal growth − inflation = 3 − 5 = −2%. The rise in nominal GDP only reflects higher prices.
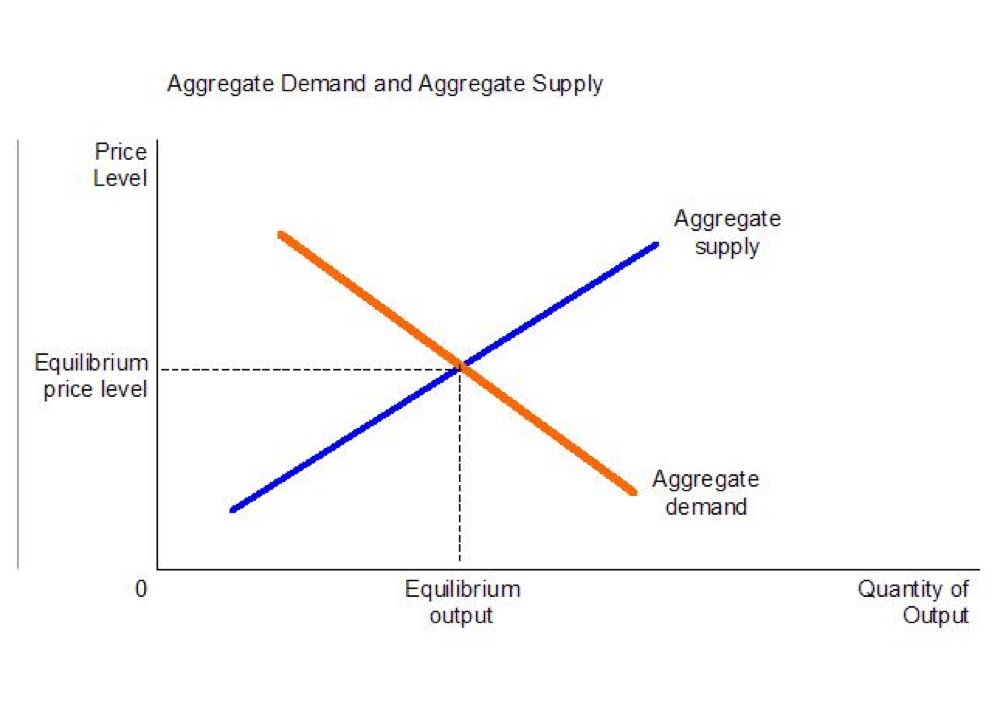
In the diagram, the intersection of the AD and AS curves determines:
Potential output and the natural rate of unemployment
The equilibrium price level and real output
The multiplier and the marginal propensity to consume
Nominal and real interest rates
The AD-AS intersection gives the equilibrium price level and real GDP in the short run. Image: Adeist, public domain, via Wikimedia Commons.
An economy is in an inflationary gap. If no policy responds, what does the long-run adjustment look like?
Wages fall, SRAS shifts right and output rises further
AD shifts left on its own and prices fall
LRAS shifts right until output matches demand
Wages rise, SRAS shifts left, the price level rises and output falls back to potential
Output above potential means tight labor markets: wages and costs rise, SRAS shifts left and the economy returns to Yf at a higher price level.
Which policy has the best chance of raising a country's long-run growth rate?
A one-time cut in income taxes
Investing in education, research and strong institutions
Lowering the central bank's interest rate for one year
Raising the minimum wage
Long-run growth comes from human capital, technology and institutions that shift LRAS. Demand-side policies change output only relative to potential.
Which statement best describes hysteresis in labor markets?
A long recession can raise the natural rate of unemployment
Unemployment always returns quickly to its prior level
Inflation expectations become unanchored
Workers' wages always rise during recessions
Workers who are jobless for long periods lose skills and connections, so the natural rate can rise and potential output can fall.
