Quiz · Medium
Twenty questions on returns, risk, diversification, beta, CAPM, performance measures, market efficiency and the dividend discount model.
You buy a share for $25, collect a $0.75 dividend and sell it for $28. The holding period return is:
12%
15%
11.2%
3%
HPR = (28 - 25 + 0.75) / 25 = 3.75 / 25 = 15%.
A portfolio gains 20% one year and loses 20% the next. Its geometric average annual return is about:
-2.02%
0.00%
-4.00%
+2.00%
Growth factor = 1.2 x 0.8 = 0.96 over two years, so the geometric mean is sqrt(0.96) - 1 = -2.02%. The arithmetic mean is 0%, which overstates compound growth.
A stock has a 40% chance of returning 15% and a 60% chance of returning 5%. The expected return is:
10%
8%
12%
9%
0.4 x 15 + 0.6 x 5 = 6 + 3 = 9%.
Two risky assets have a correlation of +0.2. Compared with the weighted average of their standard deviations, the portfolio's standard deviation will be:
The same
Higher
Lower
Zero
Only at a correlation of +1 is portfolio risk the weighted average. Below +1 diversification reduces risk.
A 50/50 portfolio of assets with standard deviations 20% and 10%, correlation +1. The portfolio standard deviation is:
12.2%
15%
10%
30%
With correlation +1, risk is the weighted average: 0.5 x 20 + 0.5 x 10 = 15%.
The covariance of a stock with the market is 0.06 and the market variance is 0.04. The stock's beta is:
1.5
0.67
0.24
2.4
Beta = Cov / Var(market) = 0.06 / 0.04 = 1.5.
Risk-free rate 2.5%, market risk premium 6%, beta 0.9. The CAPM required return is:
5.4%
8.4%
9.5%
7.9%
2.5% + 0.9 x 6% = 7.9%.
A stock plots above the security market line. According to CAPM it is:
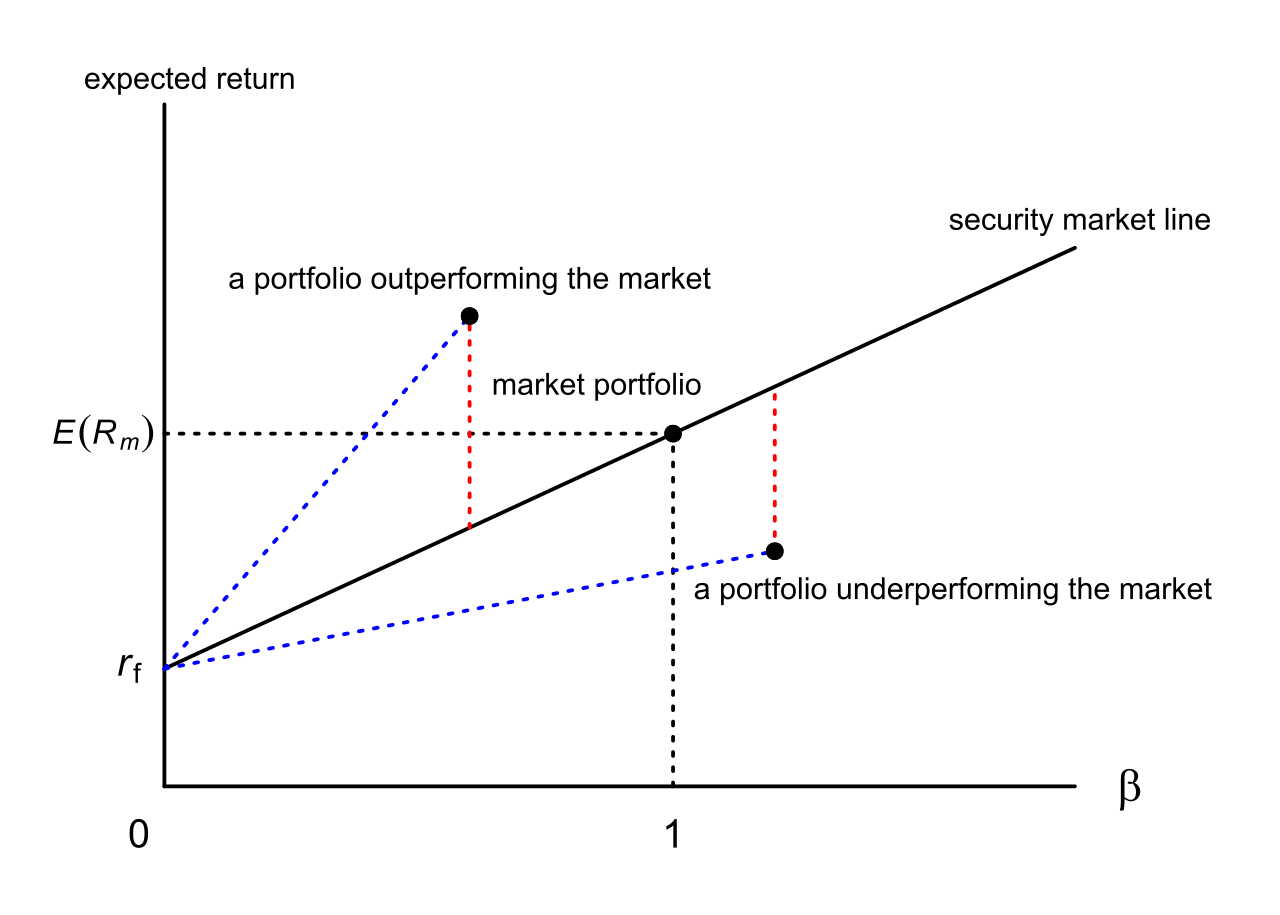
Overpriced, with a positive alpha
Fairly priced
Underpriced, with a positive alpha
Overpriced, with a negative alpha
Its expected return exceeds the return required for its beta, so its price should rise until it falls on the line.
Image: Munasca, CC BY-SA 4.0, via Wikimedia Commons.
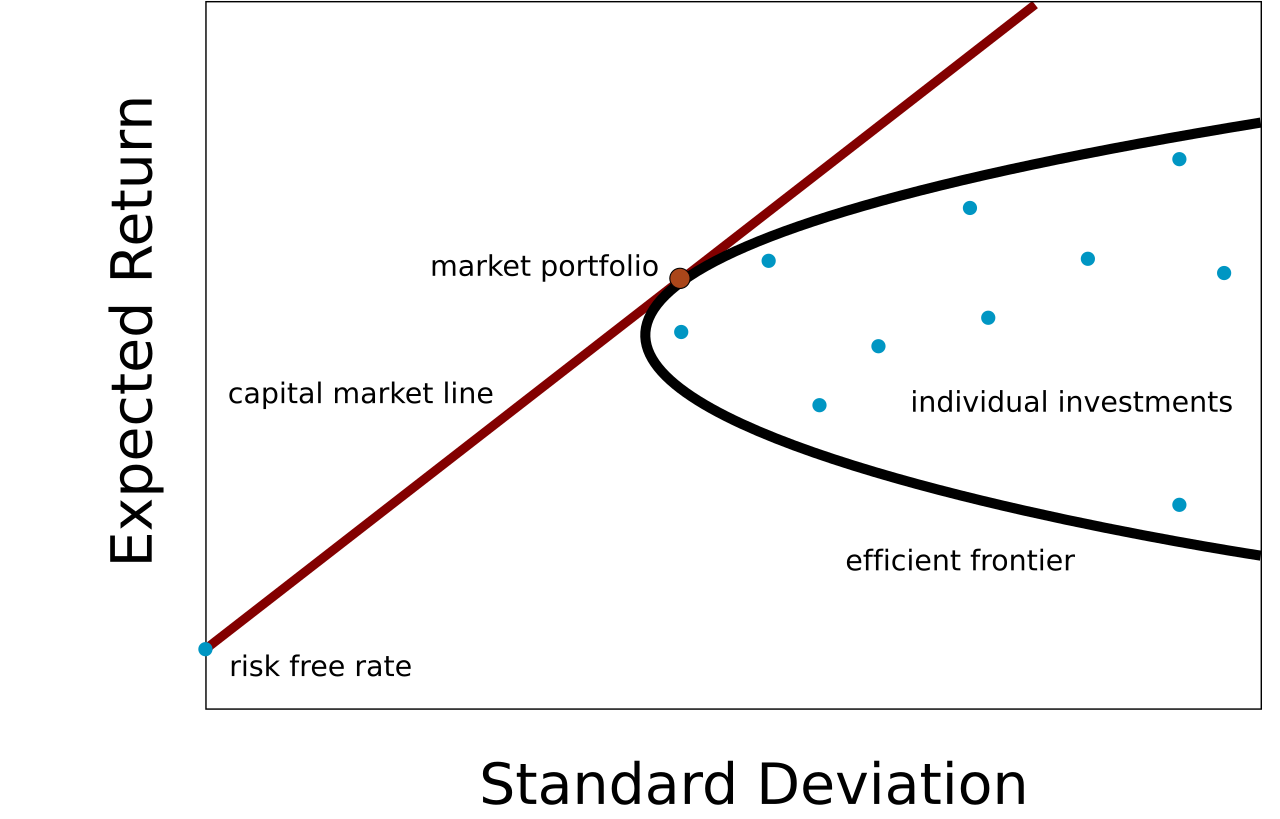
In the diagram, the point where the straight line from the risk-free rate touches the curve is:
The minimum variance portfolio
The market portfolio, the tangency portfolio
The risk-free asset
The riskiest portfolio on the frontier
The tangent from Rf gives the highest Sharpe ratio. Every investor holds this risky portfolio mixed with the risk-free asset.
Image: public domain, via Wikimedia Commons.
A fund returns 10%, the risk-free rate is 2% and the fund's standard deviation is 16%. The Sharpe ratio is:
0.50
0.63
0.08
5.00
(10 - 2) / 16 = 0.5.
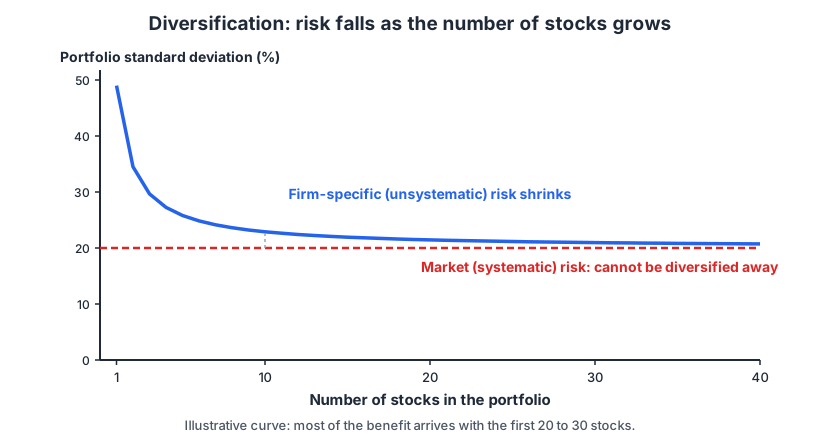
According to the chart, which risk remains however many stocks are held?
Firm-specific risk
Default risk of a single issuer
Management risk
Market (systematic) risk
Unsystematic risk diversifies away. Market-wide factors affect all stocks, so the floor stays.
A fund earned 9%. The risk-free rate is 3%, the market returned 10% and the fund's beta is 0.8. Jensen's alpha is closest to:
+1.0%
0%
+0.4%
-0.4%
CAPM return = 3 + 0.8 x 7 = 8.6%. Alpha = 9 - 8.6 = 0.4%.
If markets are semi-strong form efficient, which strategy should not earn abnormal returns?
Trading on insider information
Trading on published earnings announcements and analyst reports
Buying and holding an index
Earning a risk premium for bearing risk
Semi-strong efficiency says prices already reflect all public information. Insider information is non-public, so only the strong form rules out profits from it.
Dividend just paid is $2 and expected to grow 5% forever. The required return is 10%. Using the Gordon model, the value is:
$42.00
$40.00
$20.00
$44.10
D1 = 2 x 1.05 = 2.10. P0 = 2.10 / (0.10 - 0.05) = 42.
Payout ratio 60%, required return 11%, growth 5%. The justified forward P/E is:
12
5.5
20
10
0.6 / (0.11 - 0.05) = 10.
An investor sells winning stocks quickly but holds losers hoping to break even. This bias is called:
Anchoring
Herding
The disposition effect
Mean-variance optimization
Investors realize gains early and delay realizing losses, which is also costly for taxes.
The main reason many advisers recommend low-cost index funds is that:
Index funds never lose money
Before costs the average active manager earns the market return, so after costs lower fees win on average
Active managers always underperform
Index funds have higher expected returns than the market
Fees are the one thing investors control. Index funds capture market returns at very low cost.
A portfolio returned 12%, with Rf = 3% and beta 1.5. Its Treynor ratio is:
6%
9%
8%
4%
(12 - 3) / 1.5 = 6.
The key difference between APT and CAPM is that APT:
Needs only one factor
Ignores risk premiums
Requires investors to be risk-neutral
Allows multiple risk factors and relies on no-arbitrage rather than a single market factor
APT prices assets with several systematic factors. CAPM is a one-factor model based on mean-variance investors.
The capital market line plots expected return against which measure of risk?
Beta
Covariance with the market
Standard deviation (total risk)
Credit rating
The CML applies to efficient portfolios and uses total risk. The security market line uses beta (systematic risk) and applies to any asset.
