Quiz · Medium
Twenty questions on measuring development (HDI, Gini, poverty), basic growth models, demographic transition and case studies, with maps and charts.
Which three dimensions make up the Human Development Index?
Income, employment and inflation
Exports, savings and investment
Health, education and standard of living
Population, democracy and trade
Life expectancy, schooling and GNI per capita (PPP) feed the three dimension indices.
Which statement about the HDI is correct?
It is a geometric mean of three dimension indices between 0 and 1
It is an arithmetic mean
It ranges from 0 to 100 percent of GDP
It ignores income
A geometric mean limits how far a strong dimension can make up for a weak one.
A country has an HDI of 0.62. Which category is it in?
Medium
High
Very high
Low
Medium is 0.550-0.699. High starts at 0.700 and very high at 0.800.
On this map, the lowest HDI values are concentrated mainly in...
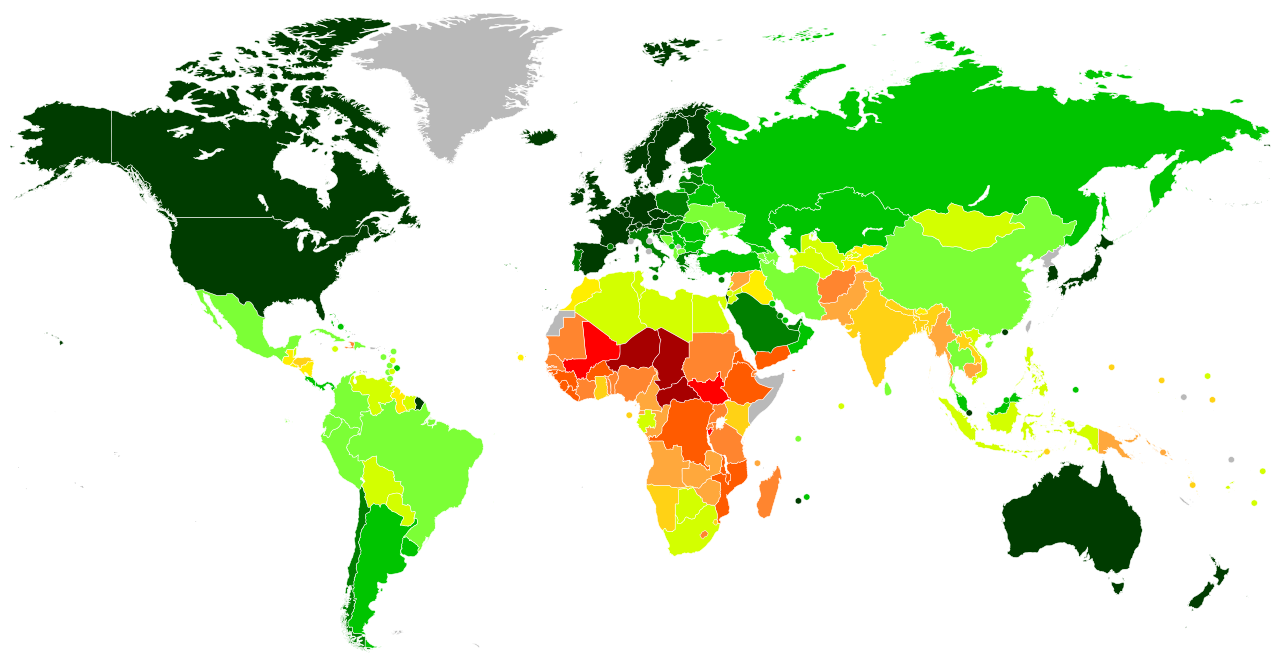
the Sahel and Central and Eastern Africa
South America
Western Europe
Australia
Red and orange shades mark low HDI.
Image: JackintheBox, CC BY-SA 4.0, via Wikimedia Commons.
The Gini coefficient is 0 when...
everyone has the same income
the Lorenz curve is bowed far below the diagonal
the poor have more than the rich
one person has all the income
At perfect equality the Lorenz curve lies on the 45-degree line.
In the Lorenz curve diagram, the Gini coefficient is measured by...
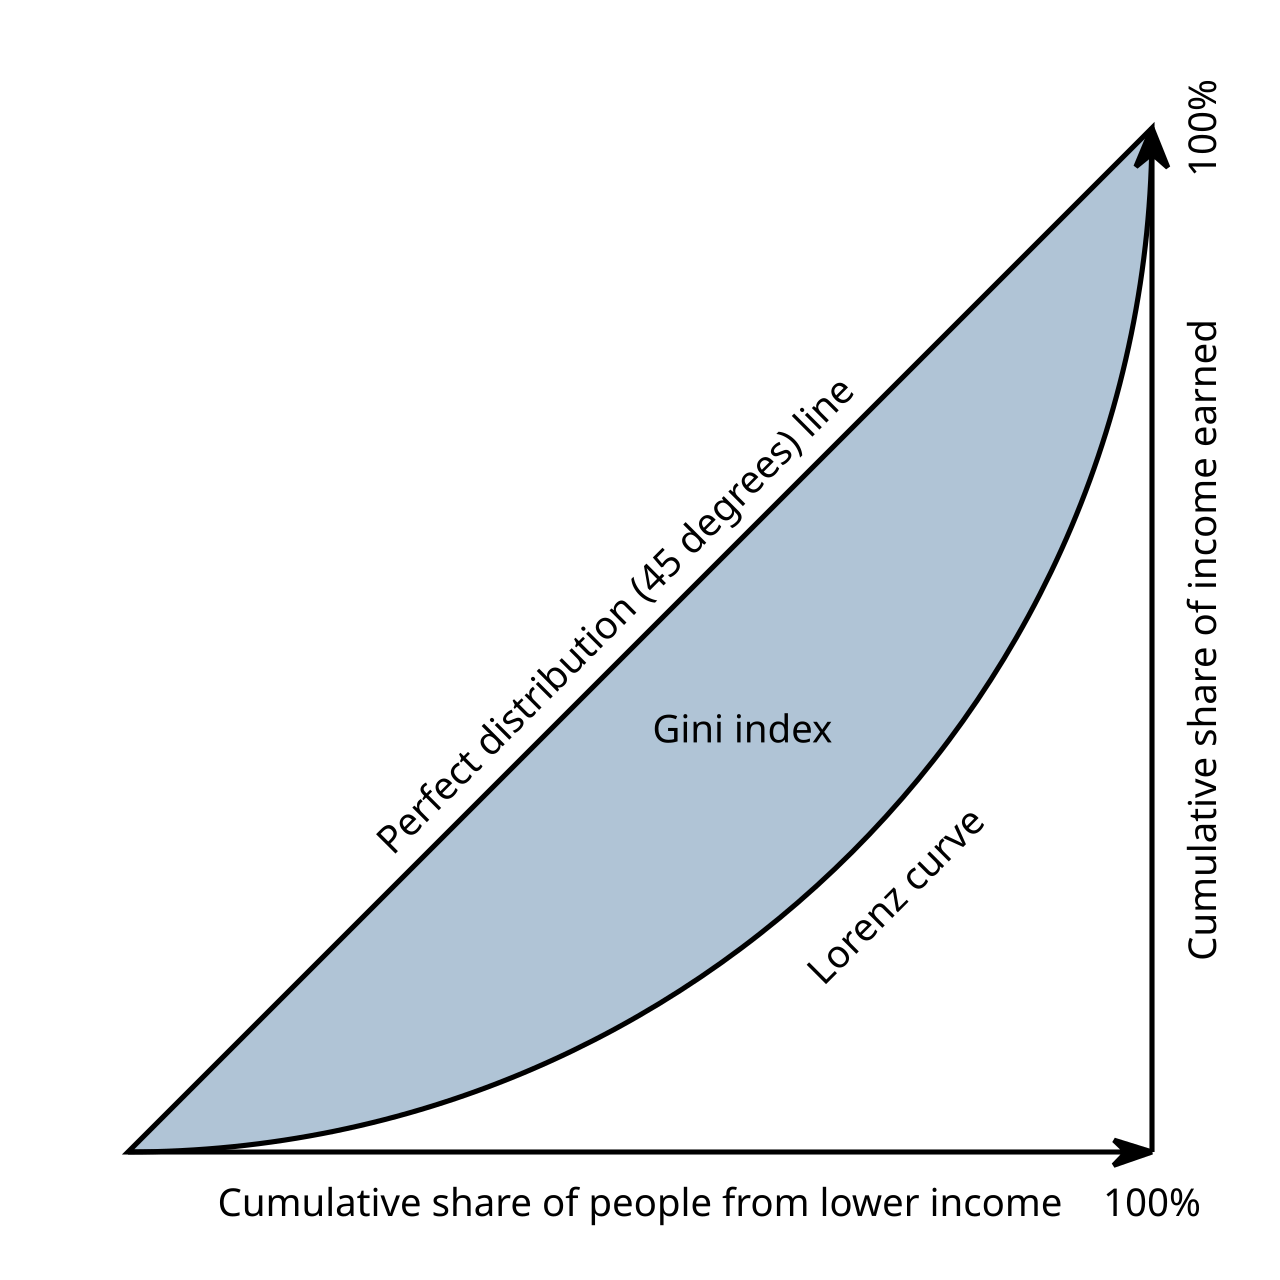
the area between the equality line and the Lorenz curve, as a share of the area under the equality line
the area under the Lorenz curve alone
the length of the Lorenz curve
the slope of the Lorenz curve
A larger shaded area means a larger Gini.
The Kuznets curve suggests that as income per capita rises, inequality...
stays constant
first rises and then falls
always rises
always falls
It is an inverted U, though the evidence for it is mixed.
Why are PPP exchange rates used to compare incomes across countries?
They reflect the market exchange rate
They remove inflation only
They measure population
They adjust for price differences between countries
Non-traded services are cheaper in poor countries, so market exchange rates understate real incomes.
Which model explains growth as saving divided by the capital-output ratio?
Solow
Heckscher-Ohlin
Harrod-Domar
Lewis
g = s/k.
According to the Lewis model, the modern sector grows by...
reducing capital
protecting agriculture
raising wages immediately
hiring surplus labor from agriculture at a constant wage
Surplus labor has near-zero marginal product, so it can move without reducing farm output.
The Solow model predicts that, holding saving and technology equal, poor countries will...
never grow
grow faster than rich countries (conditional convergence)
grow slower
have higher saving
The marginal product of capital is higher where capital per worker is low.
In stage 2 of the demographic transition...
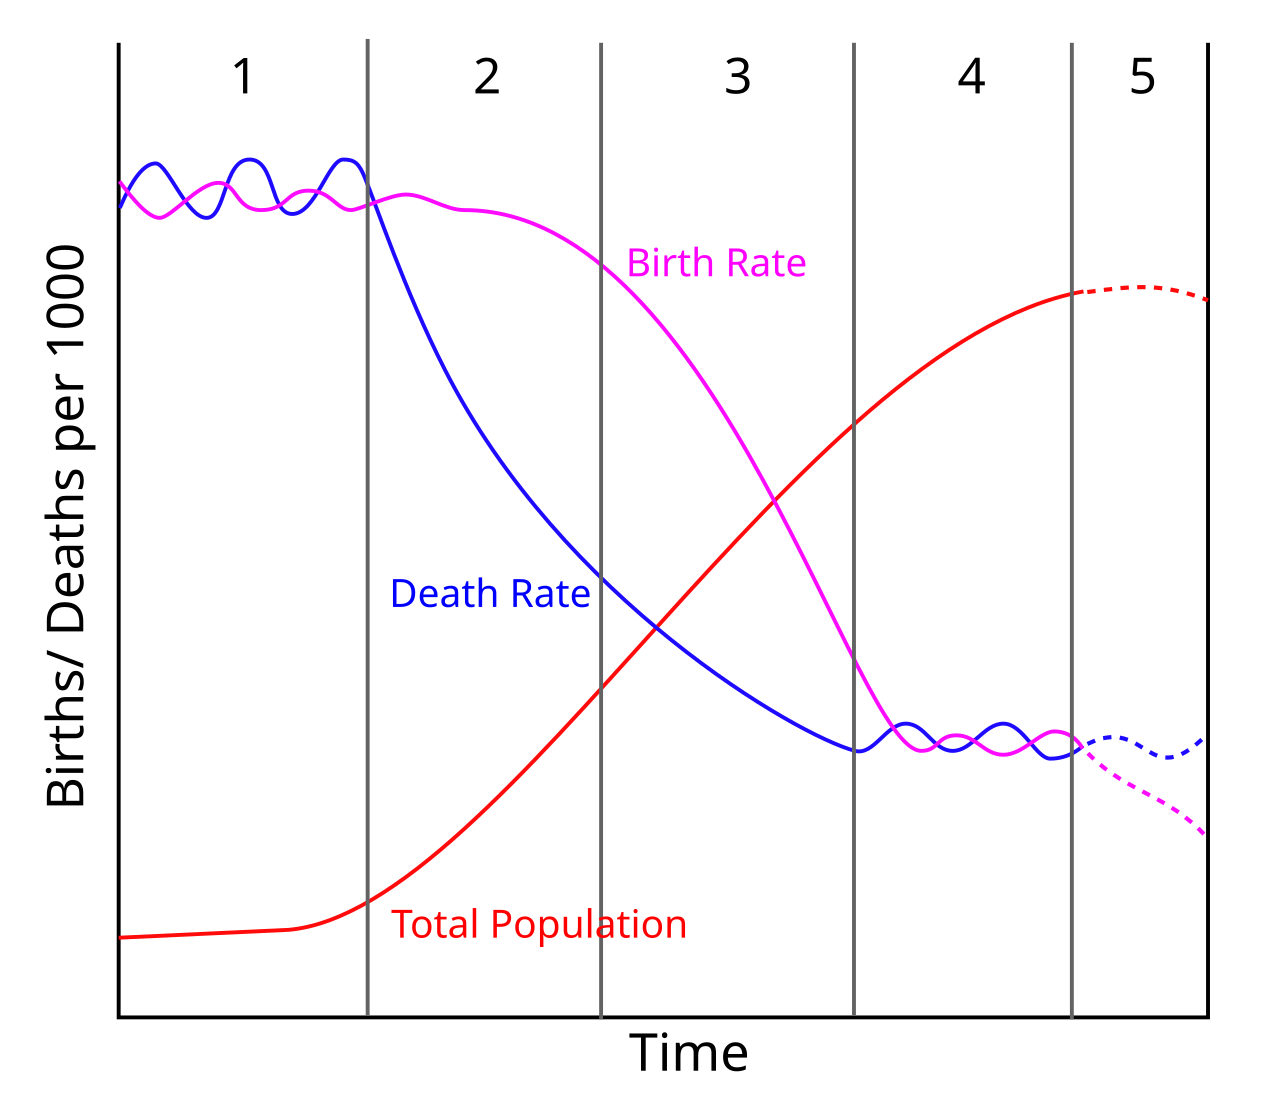
both rates are high
birth rates fall below death rates
death rates fall while birth rates stay high
both are low and stable
This gap produces rapid population growth.
Public domain diagram.
England and Wales in 1800, as shown in the chart, was mostly in which stage?
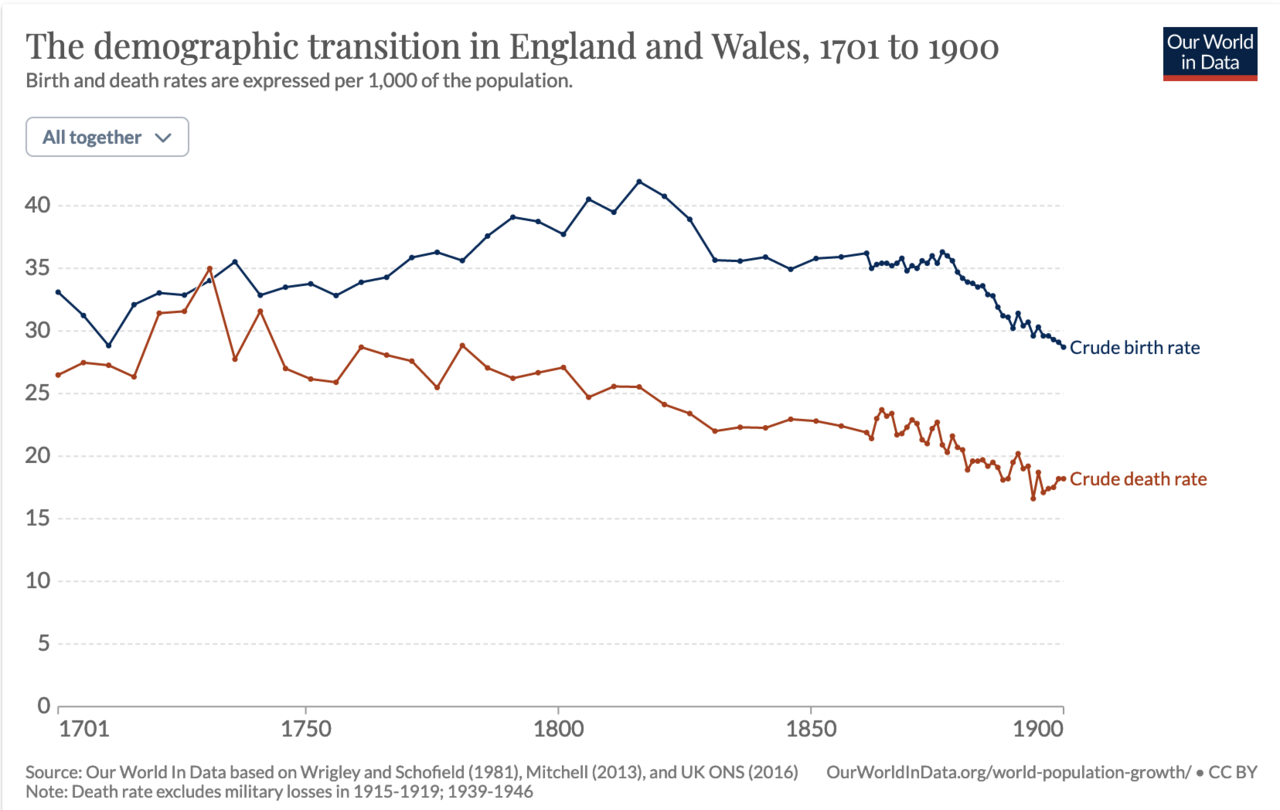
Stage 2
Stage 1
Stage 5
Stage 4
The death rate was falling while the birth rate stayed high. The birth rate only began to fall markedly in the late 1800s.
Image: Max Roser, Hannah Ritchie, Esteban Ortiz-Ospina and Lucas Rodes-Guirao (Our World in Data), CC BY 4.0, via Wikimedia Commons.
Who won the Nobel Peace Prize in 2006 for pioneering microcredit with the Grameen Bank?
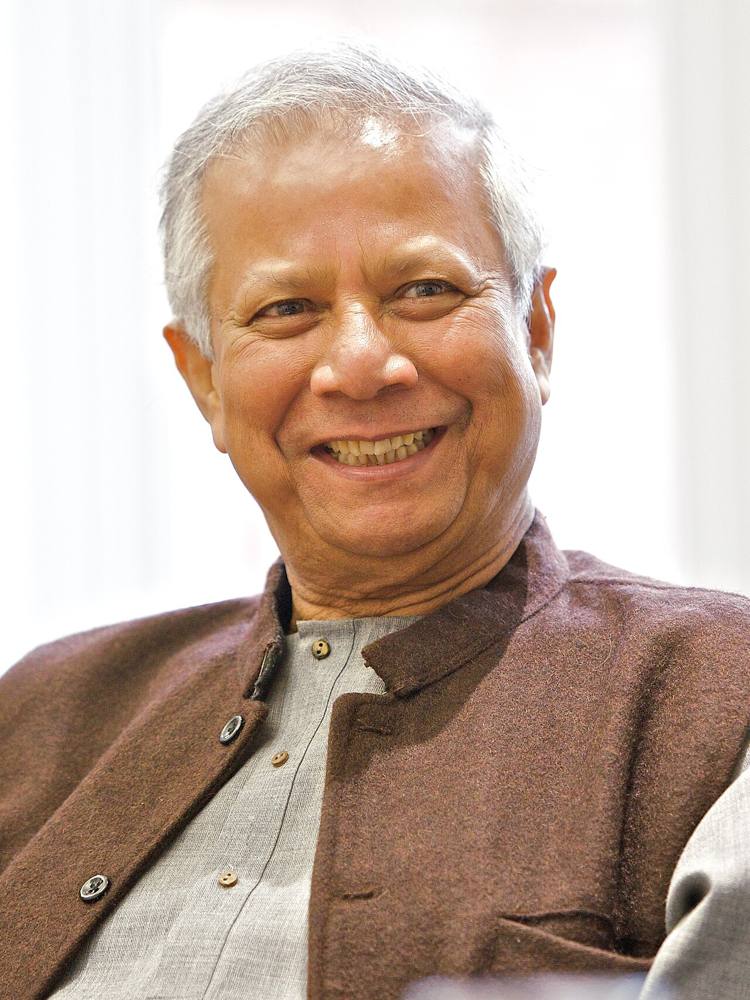
Amartya Sen
Norman Borlaug
Muhammad Yunus
Jeffrey Sachs
Yunus' group lending reached poor borrowers without collateral.
Image: University of Salford Press Office, CC BY 2.0, via Wikimedia Commons.
This Kenyan mobile money service launched in 2007 is called...
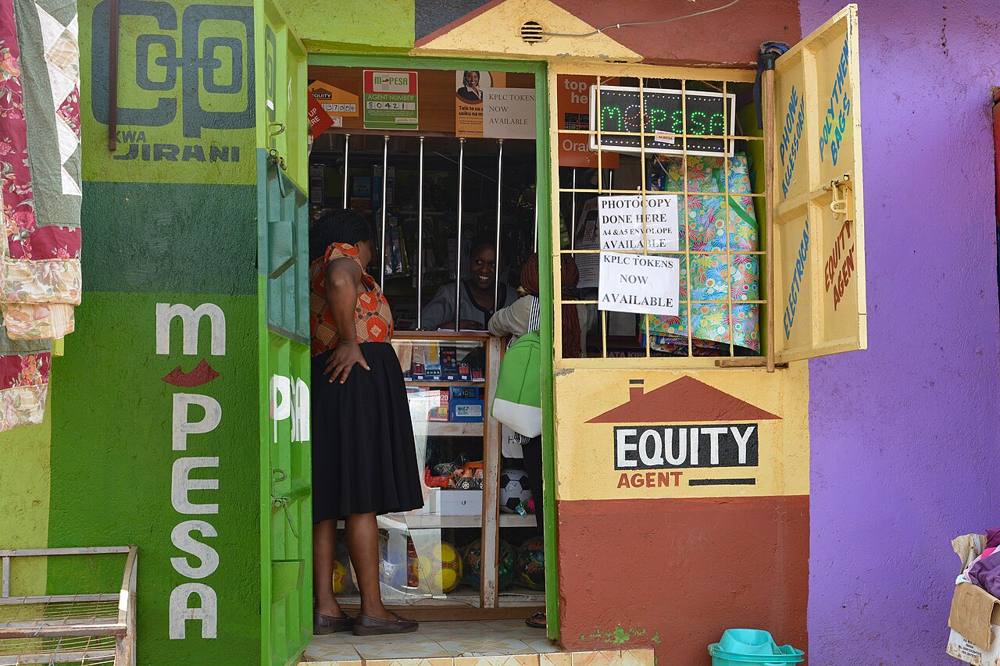
Venmo
PayPal
M-Pesa
Grameen
Mobile money agents extend financial services to people without bank accounts.
Image: Fiona Graham, CC BY-SA 2.0, via Wikimedia Commons.
The Green Revolution of the 1960s raised crop yields mainly through...
high-yield seed varieties, fertilizer and irrigation
mechanized fishing
land redistribution only
tariffs
Borlaug's semi-dwarf wheat and IR8 rice were central.
The Preston curve shows a relationship between...
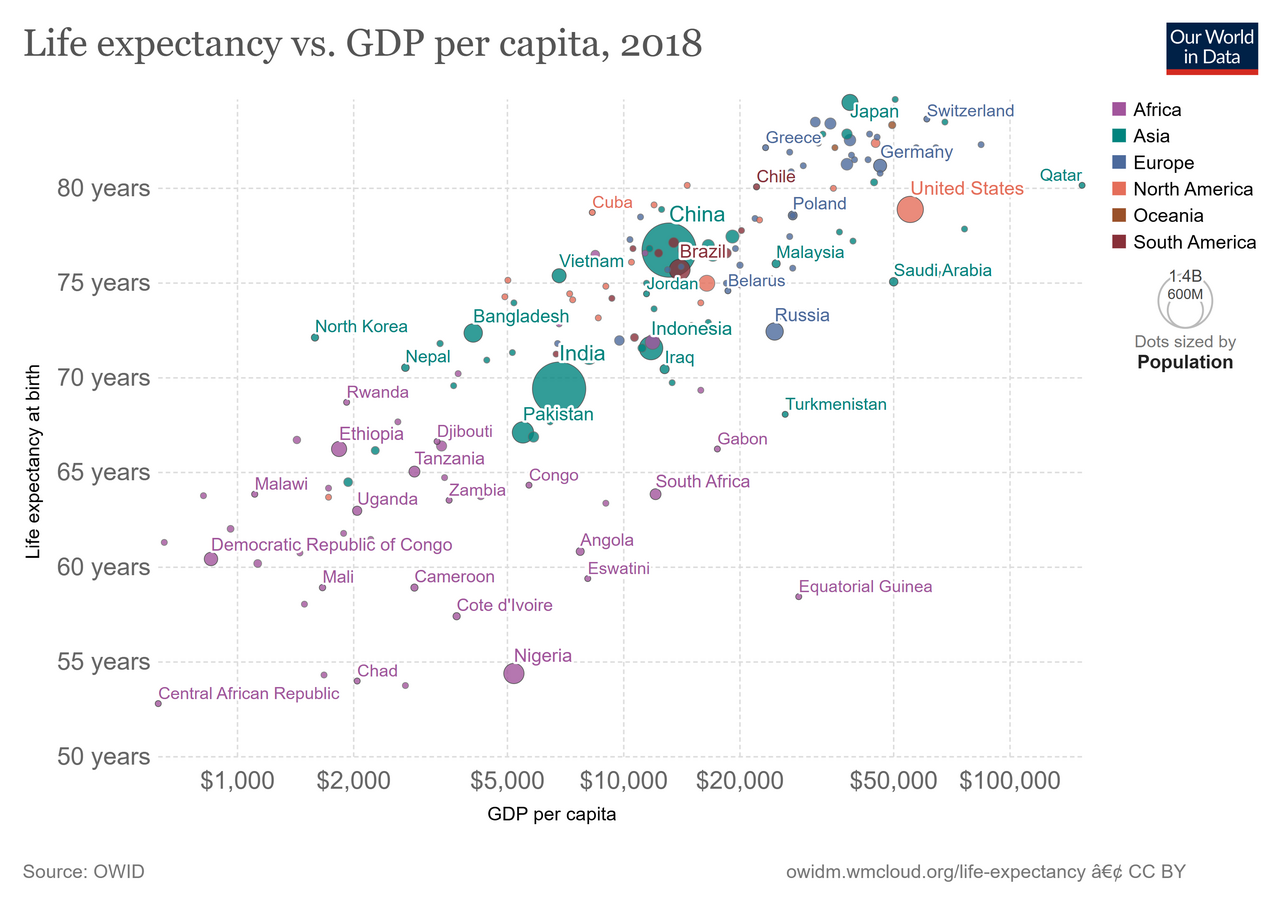
life expectancy and income per capita
inflation and unemployment
saving and interest rates
inequality and growth
The relationship is positive and concave: gains are largest at low incomes.
Image: Our World in Data (via MDWiki), CC BY 4.0, via Wikimedia Commons.
How many Sustainable Development Goals were adopted in 2015?
12
10
8
17
The eight MDGs of 2000 were replaced by 17 SDGs for 2030.
This map shows extreme poverty (2023). Where is the share of people in extreme poverty highest?
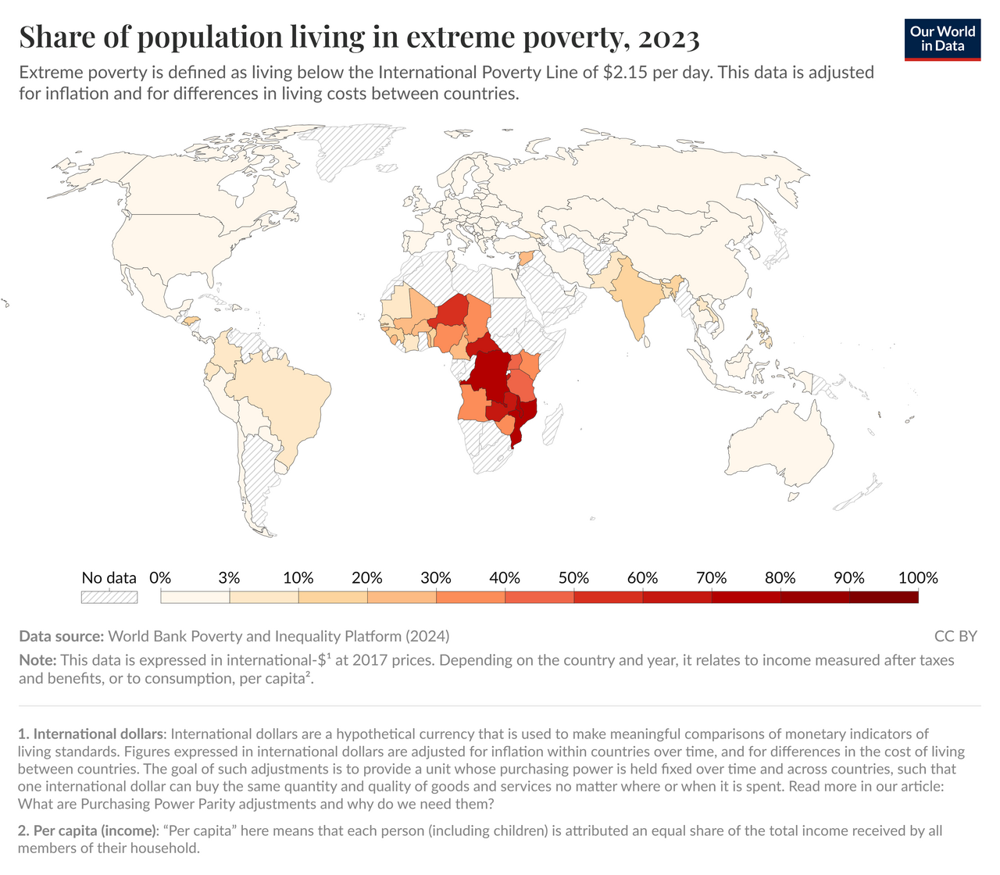
East Asia
North America
Sub-Saharan Africa
Western Europe
Most other regions have low shares.
Image: Max Roser (Our World in Data), CC BY 4.0, via Wikimedia Commons.
