Quiz · Medium
Questions on sampling methods, validity and reliability, classic studies and ethics, and reading simple statistics and graphs.
A sociologist wants to know whether students in her district are satisfied with school. She randomly selects 20 schools and surveys every student in them. Which sampling method is this?
Cluster sampling
Stratified sampling
Systematic sampling
Quota sampling
Whole groups (schools) were randomly chosen and every member surveyed. Stratified sampling would sample within every group. Quota sampling is non-random.
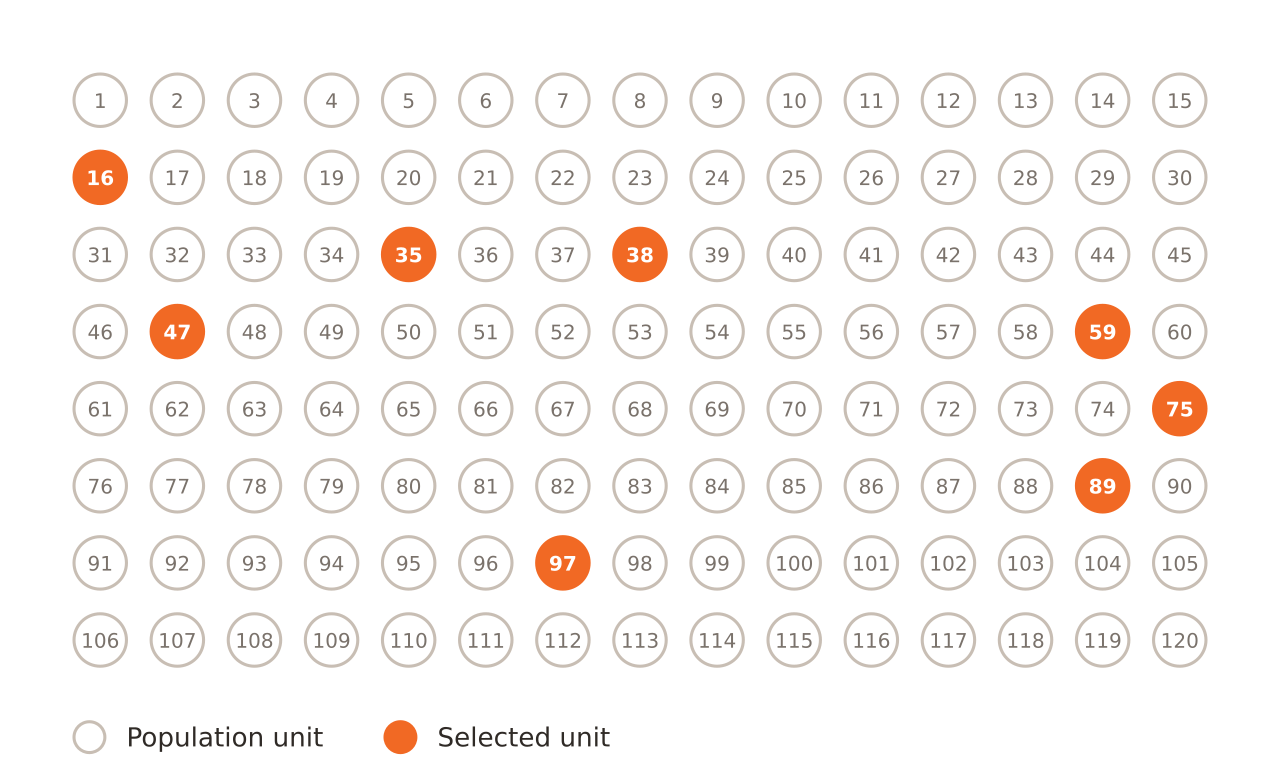
The diagram shows which sampling method?
Cluster sampling
Systematic sampling
Stratified sampling
Simple random sampling
Selected units are scattered with no pattern and each had the same chance of selection. In systematic sampling the picks are evenly spaced. Image: Derek Jansen, CC BY 4.0, via Wikimedia Commons.
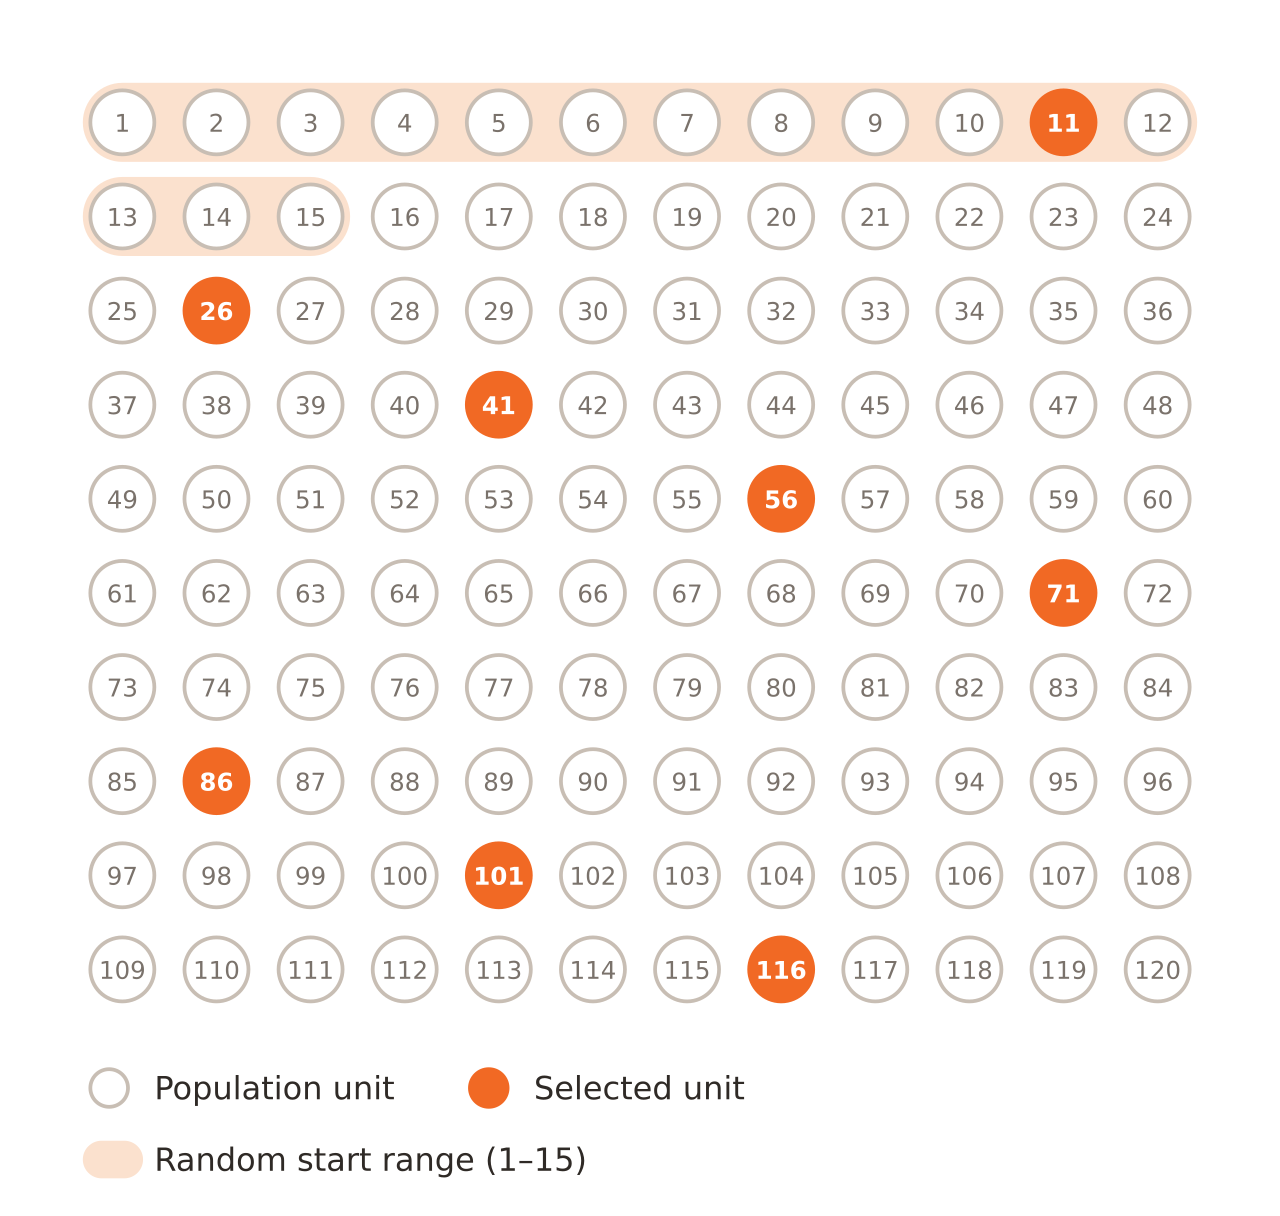
A sample of 8 is drawn from 120 units starting at 11, then 26, 41, 56, 71, 86, 101 and 116. Which method is this and what is the sampling interval?
Systematic; interval 8
Cluster; interval 15
Systematic; interval 15
Simple random; interval 8
The interval is N/n = 120/8 = 15, and the start (11) falls between 1 and 15. Students often divide by the wrong number. Image: Derek Jansen, CC BY 4.0, via Wikimedia Commons.
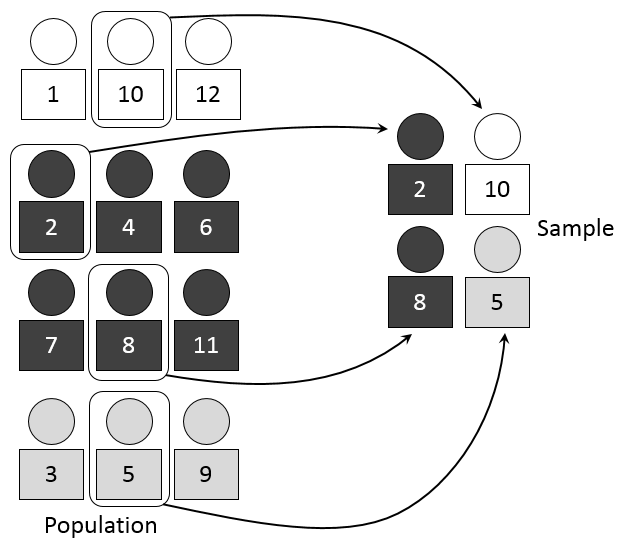
Why might a researcher prefer stratified sampling to simple random sampling when studying a small ethnic minority?
It removes all sampling error
It does not need a sampling frame
It is always cheaper
It guarantees enough members of the minority are in the sample
Strata ensure small groups are represented. Stratification reduces but doesn't remove error and still needs a frame, so the other options are wrong. Image: Dan Kernler, CC BY-SA 4.0, via Wikimedia Commons.
A study of drug users recruits one participant who introduces others, who then introduce more. This is...
systematic sampling
snowball sampling
stratified sampling
quota sampling
Snowball sampling reaches hidden populations that have no sampling frame, but cannot support statistical generalization.
A bathroom scale always shows a weight 3 kg too high every time. It is...
reliable but not valid
both reliable and valid
neither reliable nor valid
valid but not reliable
Consistent results (reliability) can still be wrong (validity). A valid measure must also be reliable.
Which variable pair is correct for the hypothesis 'Higher education leads to higher income'?
Independent: income; dependent: education
Independent: education; dependent: income
Independent: both; dependent: neither
Both are dependent variables
The presumed cause is the independent variable and the outcome the dependent variable. If you reverse them you are testing a different hypothesis.
What is operationalization?
Randomly assigning people to groups
Debriefing participants
Testing a hypothesis with statistics
Turning an abstract concept into measurable indicators
For example, 'social class' might be measured by income, education and occupation. Random assignment belongs to experiments.
Weber's idea of Verstehen leads researchers toward...
official statistics only
laboratory experiments
qualitative methods that interpret meanings
random sampling of large populations
Verstehen is interpretive understanding of actors' meanings. Positivists such as Durkheim preferred statistics and objective social facts.
Which is a key criticism of using official statistics, according to interpretivists?
They are too expensive
They are socially constructed through decisions about what to count
They are always out of date
They never include large numbers
Jack Douglas's critique of Durkheim's suicide data argued that coroners' decisions, not objective facts, create the numbers.
The Hawthorne effect is best defined as...
workers being more productive in brighter lighting
participants dropping out of studies
people changing behavior because they know they are being observed
researchers influencing results through bias
The effect is about awareness of being studied, not lighting. Experimenter bias is a separate problem.
Which pairing correctly matches the labels in Milgram's setup?
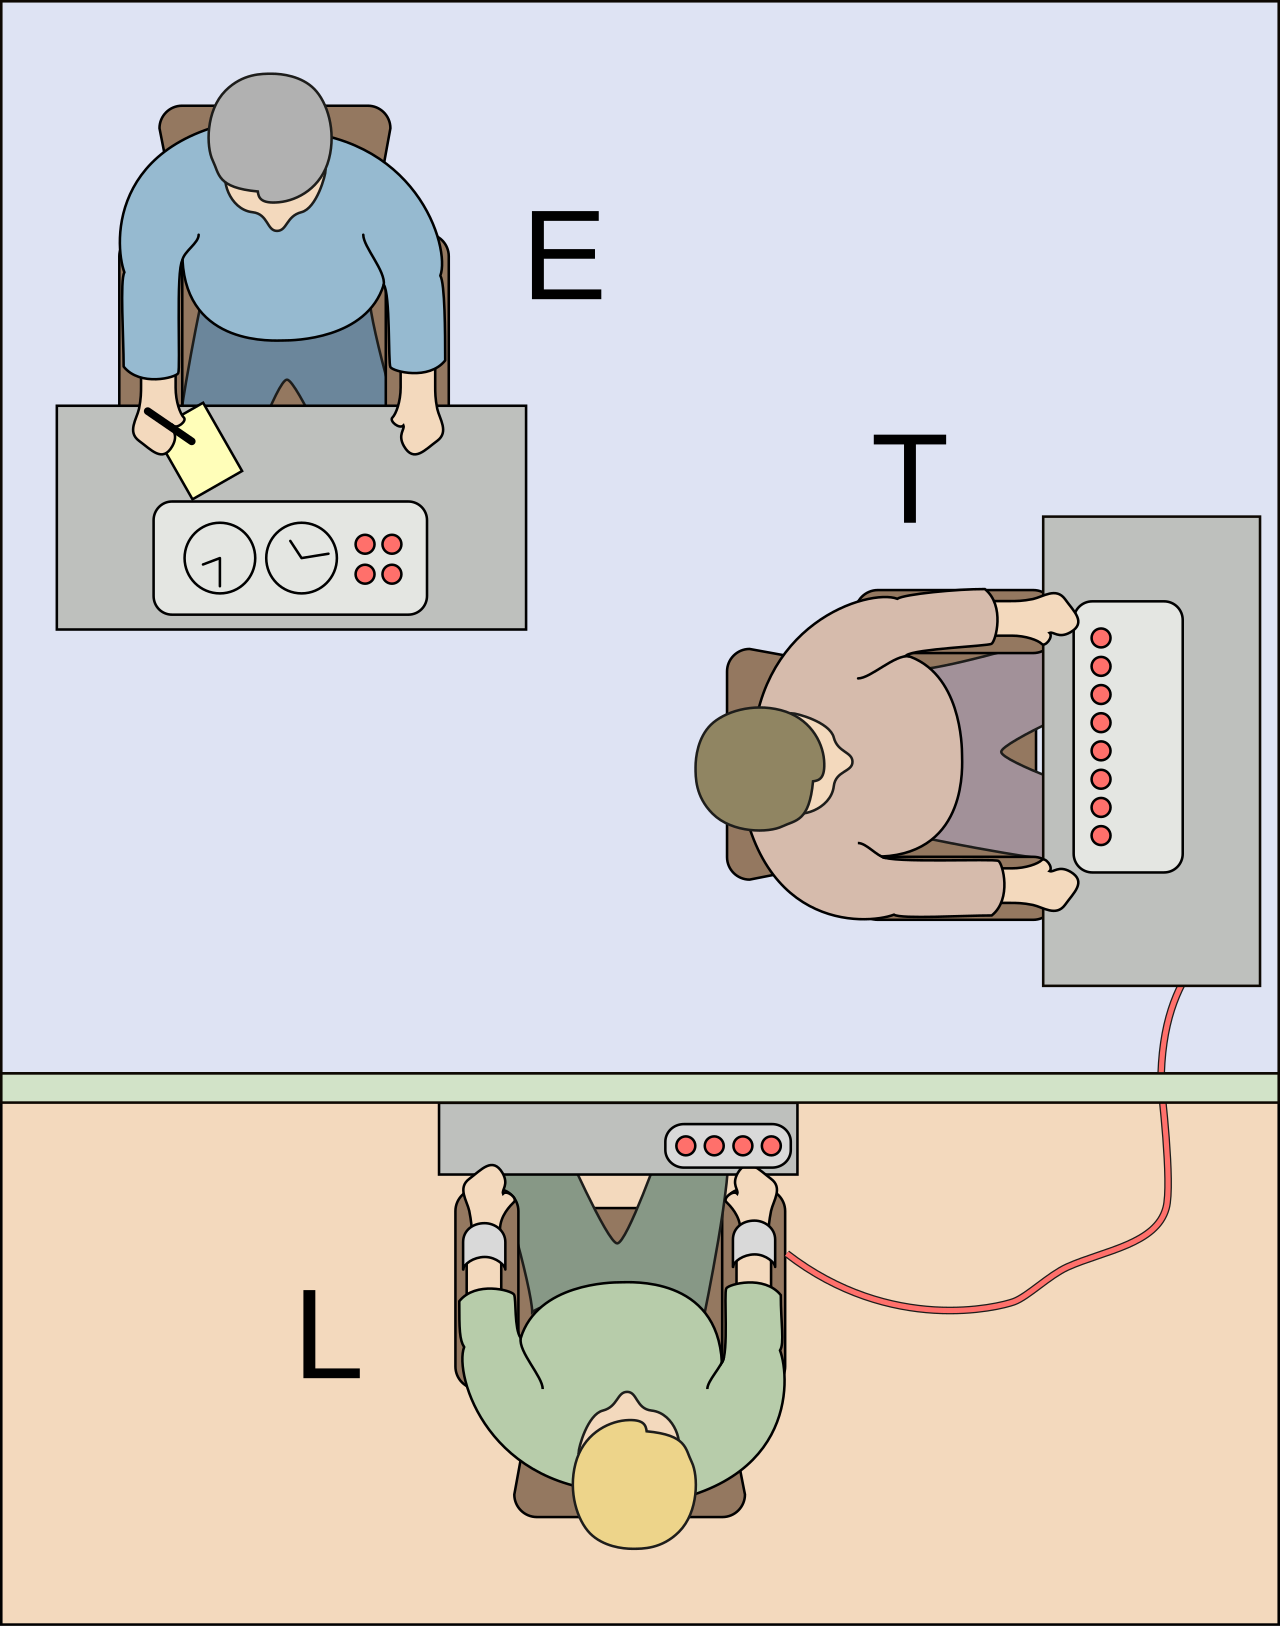
E = Evaluator, T = Teacher (actor), L = Learner (real participant)
E = Experimenter, T = Teacher (real participant), L = Learner (actor)
E = Experimenter, T = Trainee (actor), L = Learner (real participant)
E = Examiner, T = Tester, L = Lecturer
The real subject was the Teacher giving shocks. The Learner was a confederate who received none. Many students swap the roles. Image: Fred the Oyster, CC BY-SA 4.0, via Wikimedia Commons.
What did about 65% of participants do in Milgram's baseline experiment?
Reported the experiment to Yale
Delivered the maximum 450 volts
Stopped at 150 volts
Refused to start
Milgram found obedience to authority was higher than experts had predicted. It raised ethical issues of deception and distress.
Which ethical principle was violated most clearly in the Tuskegee syphilis study?
Debriefing
Anonymity
Informed consent
Random assignment
Participants were not told their diagnosis and were denied treatment. The scandal led to the Belmont Report (1979).
Anonymity differs from confidentiality because...
with anonymity even the researcher can't identify participants
they are identical in practice
anonymity means data are shared publicly
confidentiality means participants stay unnamed on the consent form
With confidentiality, the researcher knows identities but promises not to disclose them. Mixing the two terms is a common exam slip.
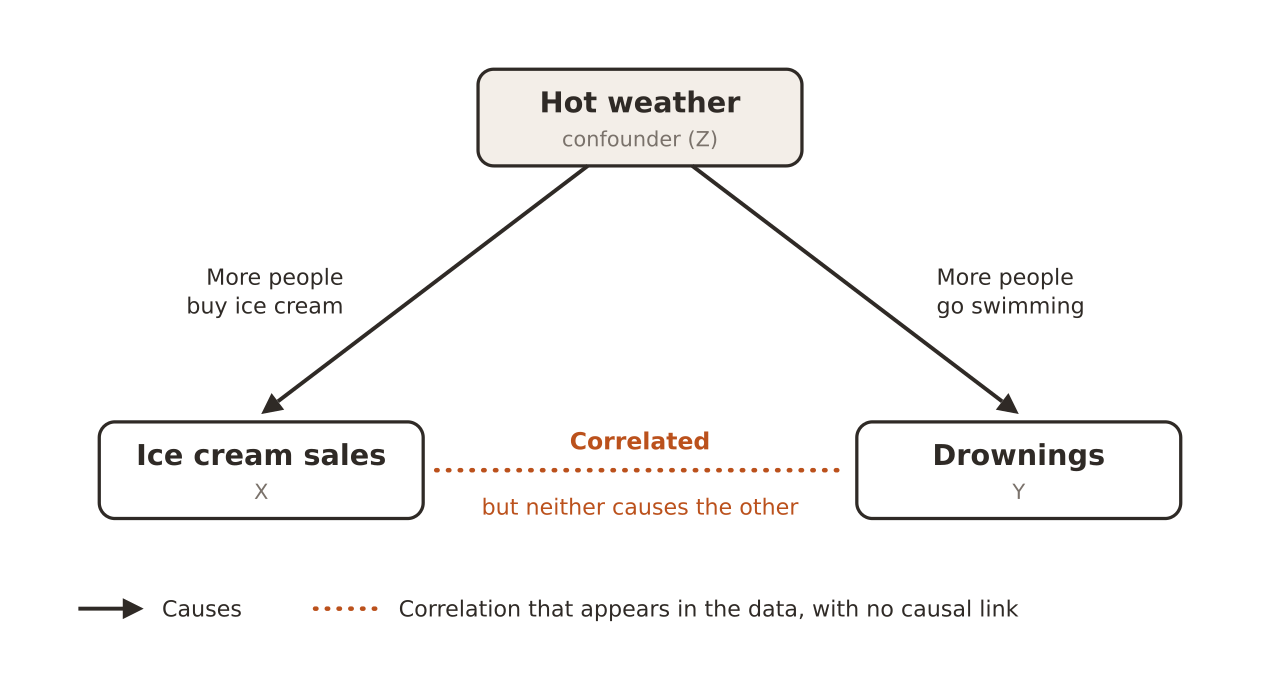
What does the diagram illustrate about ice cream sales and drownings?
Ice cream causes drownings
The correlation is negative
Drownings reduce ice cream sales
A confounding variable (hot weather) causes both, so they are correlated without a causal link
Both rise in hot weather, so the relationship is spurious. A confounder is a third variable that influences both. Image: Derek Jansen, CC BY 4.0, via Wikimedia Commons.
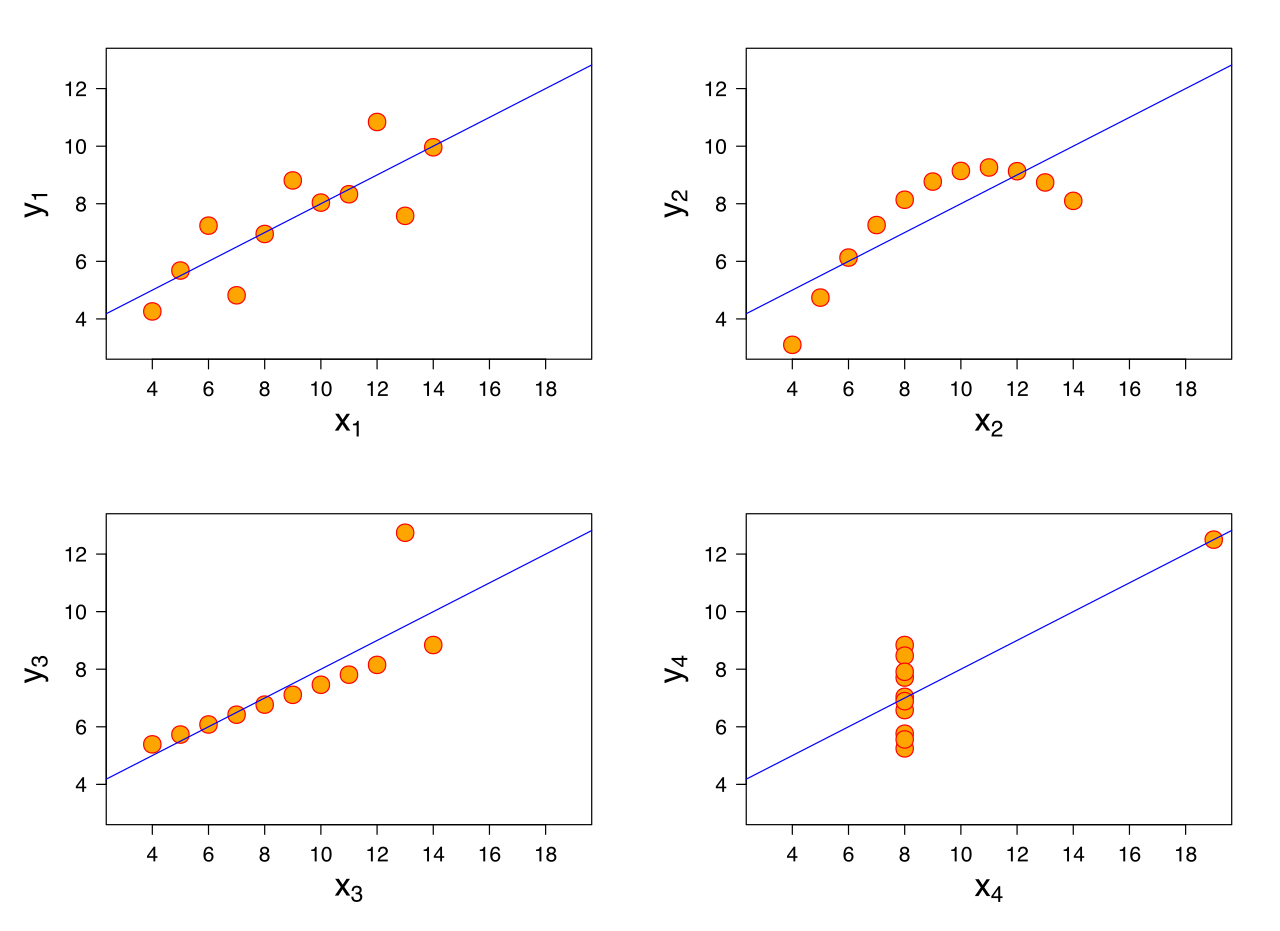
The Anscombe quartet demonstrates that...
sample size does not matter
datasets with identical summary statistics can look completely different when graphed
a correlation of 0.8 means causation
outliers never matter
All four datasets share means, variances, correlation and regression line. It argues for plotting data before trusting summaries. Image: Anscombe.svg: Schutz, CC BY-SA 3.0, via Wikimedia Commons.
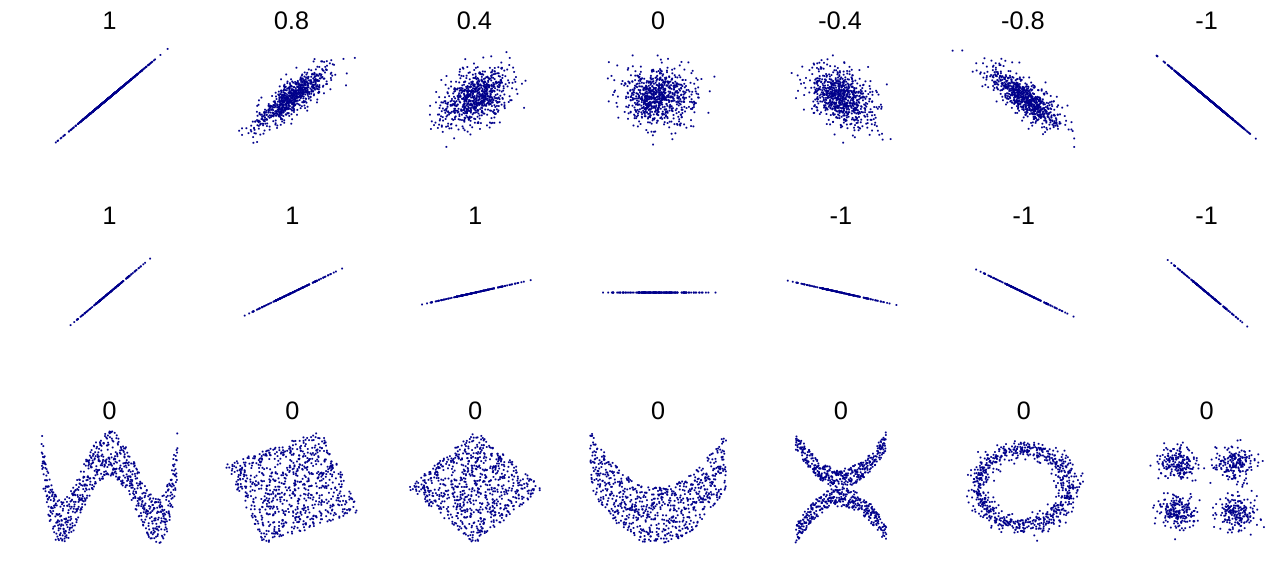
Looking at the bottom row of the correlation panels (all r = 0), what is the best conclusion?
The data must contain errors
Pearson's r misses non-linear patterns
There is no relationship in any panel
The relationships are all random noise
Clear curves and clusters can have r near zero because r measures only linear association.
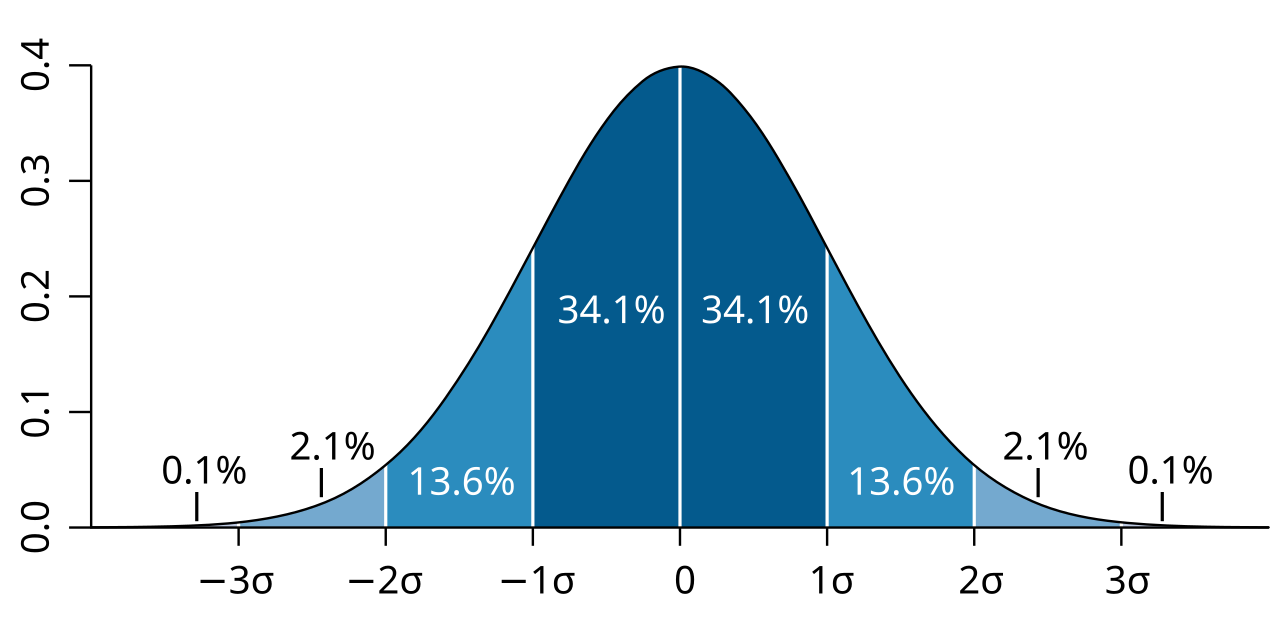
In a normal distribution about what percentage of values lies within 2 standard deviations of the mean?
About 50%
About 68%
About 99.7%
About 95%
The 68-95-99.7 rule: 68% within 1 SD, 95% within 2 SDs and 99.7% within 3 SDs. Students confuse the three figures. Image: M. W. Toews, CC BY 2.5, via Wikimedia Commons.
A 95% poll with n = 1,000 has a margin of error of about 3 points. To roughly halve it, you would need a sample of about...
1,500
2,000
4,000
10,000
Margin of error falls with the square root of n, so halving it needs about four times the sample.
A difference is 'statistically significant' at p < 0.05. Which statement is correct?
The study is certainly free of bias
There is a 95% chance the hypothesis is true
If the null hypothesis were true, a result this extreme would be unlikely (under 5%)
The effect must be large
A p-value is a probability about the data given the null, not about the hypothesis. Significance doesn't imply size or importance.
Zimbardo's Stanford Prison Experiment was stopped after six days mainly because...
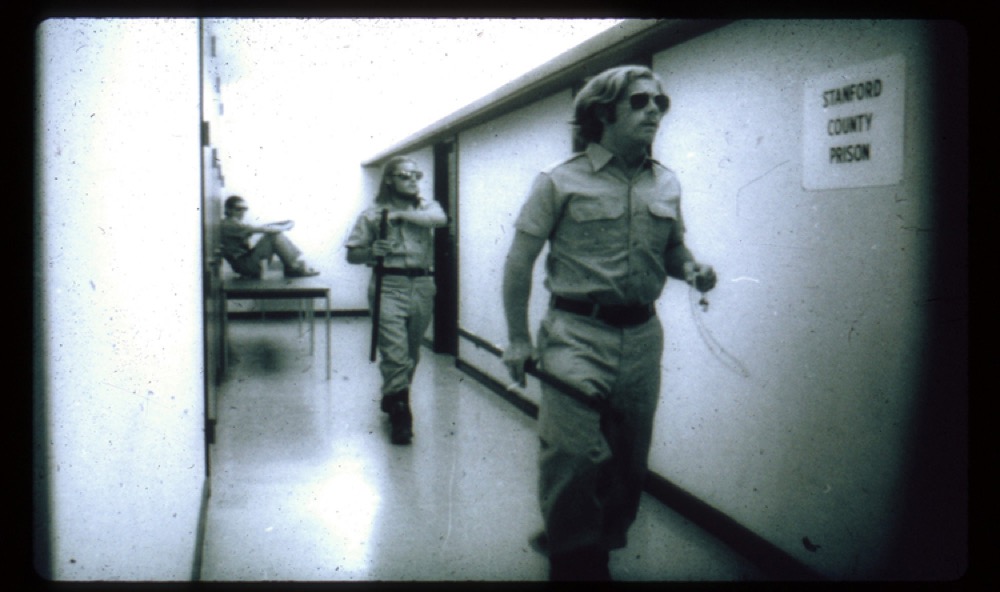
prisoners suffered severe distress and the guards' behavior became abusive
participants withdrew voluntarily
the funding ran out
the guards refused to continue
A critique of the study was that Zimbardo acted as both superintendent and researcher. It had been planned for two weeks. Image: Philip Zimbardo, CC BY-SA 4.0, via Wikimedia Commons.
Which statement describes the ecological fallacy?
Choosing questions that lead respondents
Studying people in a laboratory
Assuming that group-level patterns hold for each individual in the group
Using a sample that is too small
For example, concluding that a rich neighborhood's crime is committed by wealthy residents. W. S. Robinson named the problem in 1950.
