StudyFox
कीमतेंब्लॉगएक्सटेंशनमुफ़्त टूल
  • कीमतें
  • ब्लॉग
  • एक्सटेंशन
  • मुफ़्त टूल
  • शुरू करेंसाइन इन
StudyFox

अपने नोट्स, PDF और स्लाइड्स को फ़्लैशकार्ड, क्विज़, नोट्स और माइंड मैप में बदलें।

StudyFox खोलें

स्टडी टूल्स

  • होमवर्क हेल्पर
  • नोट मेकर
  • फ़्लैशकार्ड मेकर
  • क्विज़ मेकर
  • माइंड मैप मेकर

प्रोडक्ट

  • कीमतें
  • Chrome एक्सटेंशन
  • मुफ़्त एक्सटेंशन
  • स्टडी सेट देखें
  • ब्लॉग

सहायता

  • सहायता केंद्र
  • संपर्क करें
  • गोपनीयता नीति
  • सेवा की शर्तें

तुलना करें

  • Chegg का विकल्प
  • Course Hero का विकल्प
  • Coursology का विकल्प
  • Photomath का विकल्प
  • Gauthmath का विकल्प
  • PhotoSolve का विकल्प
  • CollegeTools का विकल्प
  • Transcript का विकल्प
  • SmartSolve का विकल्प
  • Homeworkify का विकल्प
  • AnswersAi का विकल्प
  • StudyX का विकल्प
  • Quizlet का विकल्प
  • Anki का विकल्प
  • Knowt का विकल्प
  • Brainscape का विकल्प
  • सभी तुलनाएँ

© 2026 StudyFox AI. सर्वाधिकार सुरक्षित।

  • X
  • Discord
  • Instagram
ExploreEngineering & TechOther EngineeringMaterials Science: Reading Diagrams

Quiz · Easy

Materials Science: Reading Diagrams

Short visual questions using the stress-strain curve, eutectic phase diagram and S-N curve.

by Kill h.6 questionsCreated Nov 20, 2026, 08:27 PM
Other Engineering· Materials ScienceTags#materials-science#diagrams#phase-diagram

6 questions

  1. 1

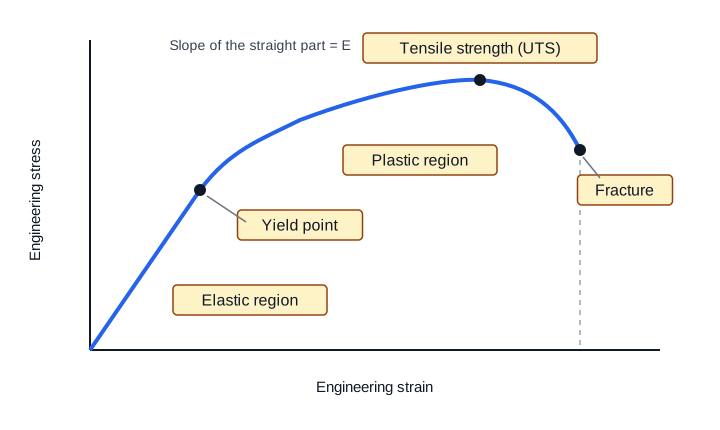
    In this stress-strain curve, which point is the ultimate tensile strength?
    • A

      The origin

    • B

      The yield point

    • C

      The fracture point

    • The highest point of the curve

    UTS is the maximum engineering stress. The yield point lies earlier and fracture later, at lower stress.

  2. 2

    What does the slope of the straight initial part represent?

    • A

      Toughness

    • Young's modulus

    • C

      Yield strength

    • D

      Poisson's ratio

    Slope = stress/strain = E.

  3. 3

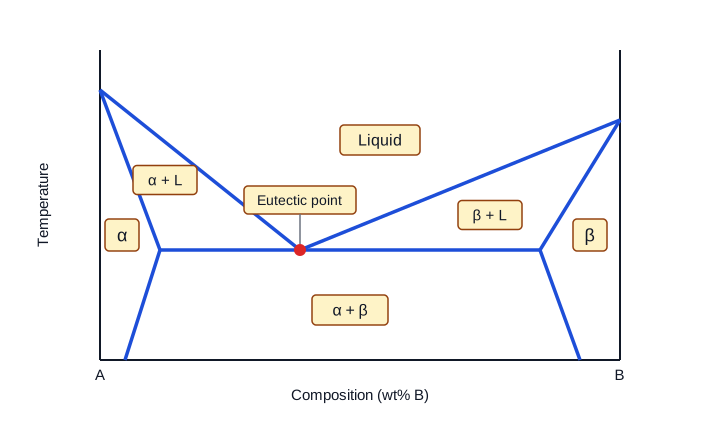
    In the eutectic diagram, what is the red point?
    • A

      Melting point of A

    • Eutectic point

    • C

      Solvus

    • D

      Peritectic point

    The liquid transforms at constant temperature into alpha + beta at the lowest-melting composition.

  4. 4

    An alloy cooling slowly from the liquid at the eutectic composition ends as:

    • A

      Pure liquid

    • B

      Pure beta

    • Alpha + beta

    • D

      Pure alpha

    Eutectic reaction: L -> alpha + beta.

  5. 5

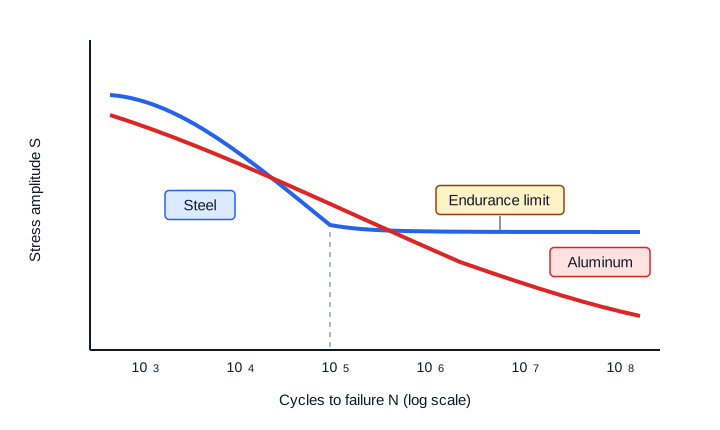
    In the S-N plot, the flat blue curve level represents:
    • Endurance limit

    • B

      Yield strength

    • C

      Creep rate

    • D

      Fracture toughness

    Below the endurance limit, steel is expected to survive indefinitely.

  6. 6

    Why is the aluminum curve different from the steel curve?

    • It has no true endurance limit

    • B

      It has higher modulus

    • C

      It never fails

    • D

      It only fails by creep

    Aluminum's S-N curve keeps falling, so fatigue strength at a chosen life is quoted.