Quiz · Easy
Visual questions on the network diagram, earned value chart and risk matrix.
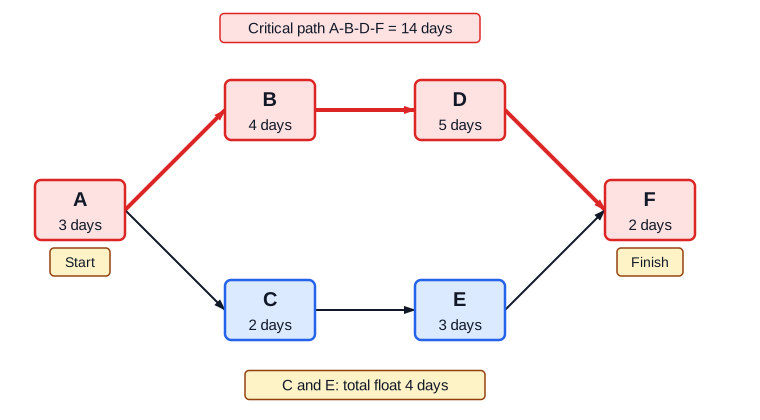
Which is the critical path in this network?
A-B-D-F
A-C-E-F
A-C-D-F
A-B-E-F
A-B-D-F is the red path with 14 days; the lower path has 10 days.
In this network, how much float do C and E share?
14 days
0 days
2 days
4 days
14 - 10 = 4 days of total float.
In the earned value chart, the gap between the EV and PV curves at the status date is the:

Cost variance
Estimate at completion
Budget at completion
Schedule variance
SV = EV - PV; cost variance is the gap between EV and AC.
In the chart, which curve shows money actually spent?
The green curve (EV)
The dashed line
The red curve (AC)
The blue curve (PV)
AC is the actual cost; PV is the plan and EV the value of work done.
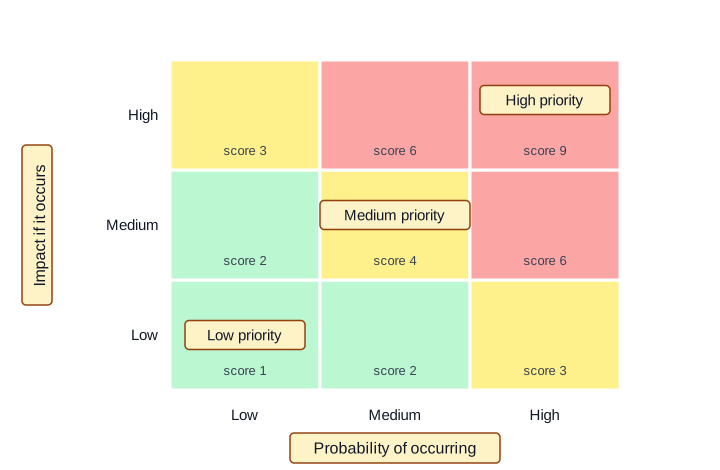
In the risk matrix, which risk deserves the most attention?
High probability, high impact
High probability, low impact
Low probability, high impact only
Low on both
The red corner combines the highest probability and impact (score 9).
In the matrix, a risk with medium probability and medium impact scores:
4
6
9
3
2 x 2 = 4, which falls in the yellow band.
