Quiz · Medium
Traffic flow, LOS, signals, planning, sight distance, horizontal and vertical curves, superelevation and pavement basics.
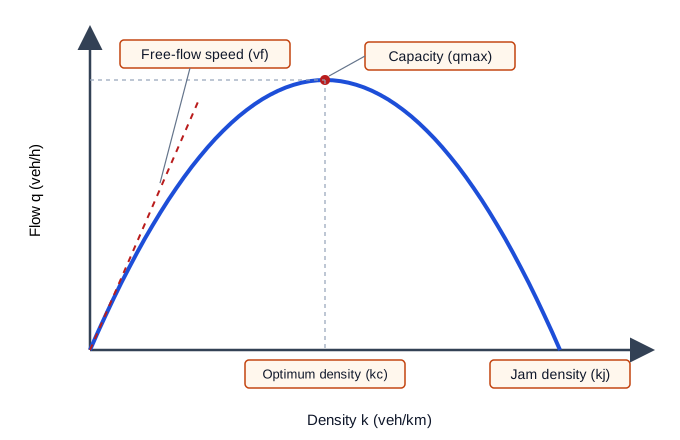
In the Greenshields model, capacity is
vf kj / 2
vf kj
2 vf kj
vf kj / 4
The parabola q = vf k (1 − k/kj) peaks at k = kj/2, giving vf kj/4.
The fundamental equation of traffic flow is
q = k / v
v = q × k
q = k × v
k = q × v
Flow (veh/h) equals density (veh/km) times speed (km/h). Rearranged, density = flow/speed.
If flow is 1,800 veh/h and the space mean speed is 60 km/h, density is
30 veh/km
108 veh/km
3.3 veh/km
1,860 veh/km
k = q/v = 1800/60 = 30 veh/km.
Space mean speed is calculated as the
arithmetic mean of spot speeds
median of spot speeds
geometric mean of spot speeds
harmonic mean of spot speeds
Space mean speed weights slow vehicles more because they spend more time on the roadway segment.
A lane carries 1,800 veh/h. The average headway is
1.8 s
2.0 s
0.5 s
3.6 s
Headway = 3600/1800 = 2 s. 0.5 would be flow per second times something else.
In the q-k diagram, the density at which flow is greatest is called the
jam density
optimum (critical) density
free-flow density
saturation density
At jam density flow is zero because vehicles are stopped.
Using HCM freeway criteria, LOS D corresponds to a density of up to
35 pc/mi/ln
18 pc/mi/ln
26 pc/mi/ln
45 pc/mi/ln
Limits: A 11, B 18, C 26, D 35, E 45. LOS F is above 45 or demand above capacity.
An hour's volume is 1,200 veh and the peak 15-minute count is 340. PHF is
0.71
1.13
0.88
0.28
PHF = 1200/(4 × 340) = 0.88. PHF cannot exceed 1.
Webster's optimum cycle length formula is
C = (L + 5)/Y
C = 1.5L/(1 + Y)
C = (5L + 1.5)/(1 − Y)
C = (1.5L + 5)/(1 − Y)
L is the total lost time per cycle and Y is the sum of the critical lane flow ratios.
The capacity of a signalized lane group equals
s × C/g
s × g/C
s × (g + y)
v × g/C
Saturation flow times the green ratio. v is demand, not capacity.
Which element sets the yellow change interval?
Pedestrian walking speed only
The cycle length
Approach speed, perception-reaction time and deceleration
The intersection width only
The all-red interval is where the intersection width and vehicle length come in.
A single-lane roundabout has how many vehicle conflict points compared with a four-leg conventional intersection with 32?
8
16
24
32
A roundabout eliminates crossing and left-turn conflicts, leaving 8 merge and diverge points.
In the four-step travel demand model, assigning trips to specific routes is
trip assignment
trip generation
trip distribution
mode choice
Generation: how many trips. Distribution: where they go. Mode choice: how they travel. Assignment: which route.
Wardrop's user equilibrium states that
total system travel time is minimized
drivers always choose the shortest distance
used routes have equal travel times
traffic splits evenly across routes
System optimum (second principle) minimizes total time. User equilibrium is selfish routing.
At 60 mph on level road, stopping sight distance (t = 2.5 s, a = 11.2 ft/s²) is about
220 ft
570 ft
350 ft
790 ft
Reaction ≈ 220 ft plus braking ≈ 346 ft. 220 alone ignores braking.
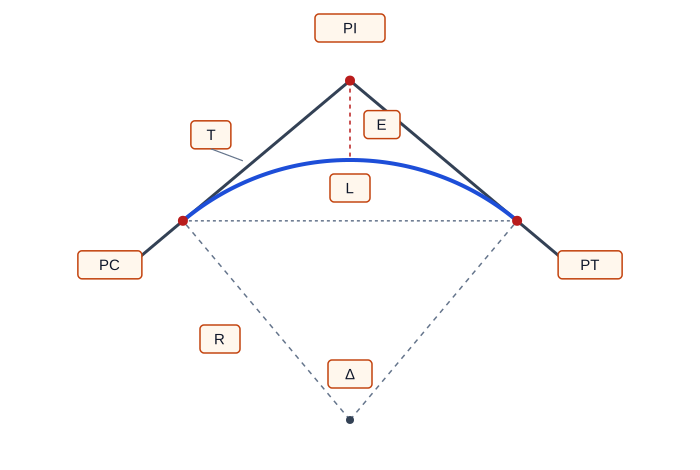
In the figure, the curve element 'T' is the
curve length
radius
external distance
tangent length from PC to PI
T = R tan(Δ/2). The curve length L is measured along the arc.
Tangent length of a circular curve with R = 1000 ft and Δ = 40° is about
698 ft
728 ft
364 ft
64 ft
T = 1000 tan 20° = 364 ft. 698 ft is the curve length; 64 ft is the external distance.
The relationship among superelevation e, friction f, speed V (mph) and radius R (ft) is
e + f = V²/(15R)
e + f = V/(15R)
e − f = V²/(15R)
e × f = V²/(15R)
Superelevation and side friction together supply the centripetal force.
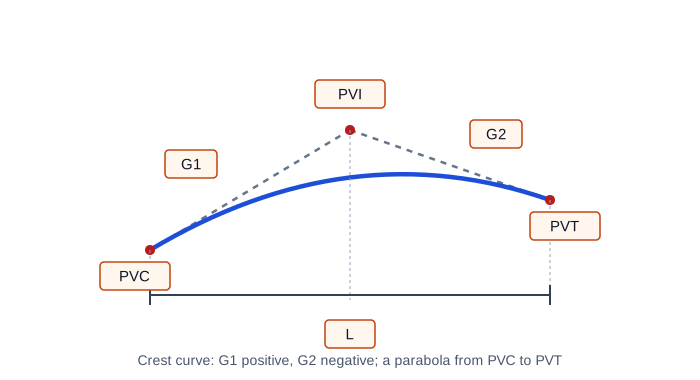
In the vertical curve figure, the point where the two tangent grades meet is the
PVC
PVT
PC
PVI
PVC and PVT are the ends of the curve.
Vertical curve K value equals
A / L
L / A
L × A
L / (200A)
K is the horizontal distance needed to change the grade by 1%.
A crest vertical curve length is generally controlled by
headlight beam distance
stopping sight distance over the crest
drainage only
pedestrian comfort
A sag curve is controlled by headlight distance at night, comfort and drainage.
Which test measures subgrade strength using penetration of a plunger?
Los Angeles abrasion
Marshall stability
Slump test
California Bearing Ratio
CBR compares load to penetrate the soil with that of crushed stone standard.
Doubling an axle load from 18 kip to 36 kip multiplies pavement damage by about
16
2
4
8
The fourth power law gives 2⁴ = 16.
A PG 64-22 binder is designed for
a penetration of 64 and softening point of 22 °C
64% aggregate and 22% filler
7-day max pavement temperature of 64 °C and minimum of −22 °C
a minimum of 64 °F and maximum of 22 °F
The first number is the high temperature grade; the second the low temperature grade.
A tack coat is used to
seal and penetrate an unbound base
provide skid resistance
fill rutting
bond a new asphalt layer to an existing surface
A prime coat is the one applied to unbound bases.
A higher space mean speed always means a higher flow on a freeway.
True
False
Flow = density × speed. In congested conditions, speeds are low with low flow; at light traffic speeds are high with low flow. Flow peaks at an intermediate density.
