Quiz · Hard
Confidence intervals, p-values, multiple testing, regression diagnostics, Simpson's paradox, regression to the mean and A/B test design with worked numbers.
A 95% confidence interval for mean session length is (4.2, 5.8) minutes. Which interpretation is correct?
There is a 95% probability that the true mean lies between 4.2 and 5.8.
If we repeated the study many times, about 95% of such intervals would contain the true mean.
95% of individual sessions last between 4.2 and 5.8 minutes.
The sample mean has a 95% chance of being 5 minutes.
Confidence refers to the long-run success rate of the procedure. The interval is about the mean, not about individual sessions (that would be a prediction or reference interval).
You want to halve the width of a confidence interval for a mean (same confidence level, same variability). What must you do?
Quadruple the sample size
Double the sample size
Halve the sample size
Increase the confidence level
The width is proportional to s divided by the square root of n. Halving it requires the square root of n to double, so n must be four times larger. Raising the confidence level makes the interval wider.
The 95% CI for the difference in mean checkout time (B minus A) is (-0.4, +1.2) seconds. What can you conclude at alpha = 0.05?
B is significantly slower than A.
B is significantly faster than A.
A and B are shown to be equal.
The difference is not statistically significant, because the interval includes 0.
An interval containing 0 means a two-sided test would not reject H0 at 5%. That is not proof of equality (an interval that wide leaves room for real differences), only a lack of evidence.
Which statement about the p-value is correct?
It is the probability that H0 is true.
It is the probability that the result occurred by chance alone.
It is the probability of results at least as extreme as the observed ones if H0 is true.
It is 1 minus the probability that the alternative hypothesis is true.
The p-value is computed assuming H0. It is a statement about the data given H0, not about H0 given the data. The wrong options all convert it into a probability about hypotheses.
An A/B test compares 10,000 users per arm. The lift in conversion is 0.05 percentage points with p = 0.001. What is the best summary?
Statistically significant, but check the effect size and the confidence interval to see whether it is practically meaningful.
Highly meaningful because p is tiny.
Not significant because the lift is small.
Invalid because the sample is too big.
A tiny p-value with a tiny effect is common in big samples. Significance is about detectability; the decision depends on the size of the lift relative to cost and goals.
You run 20 independent tests, each at alpha = 0.05, and all null hypotheses are true. About how likely is at least one false positive?
5%
20%
About 64%
100%
1 - 0.95^20 = 0.64. That is why multiple comparisons require corrections such as Bonferroni (alpha/m) or Benjamini-Hochberg.
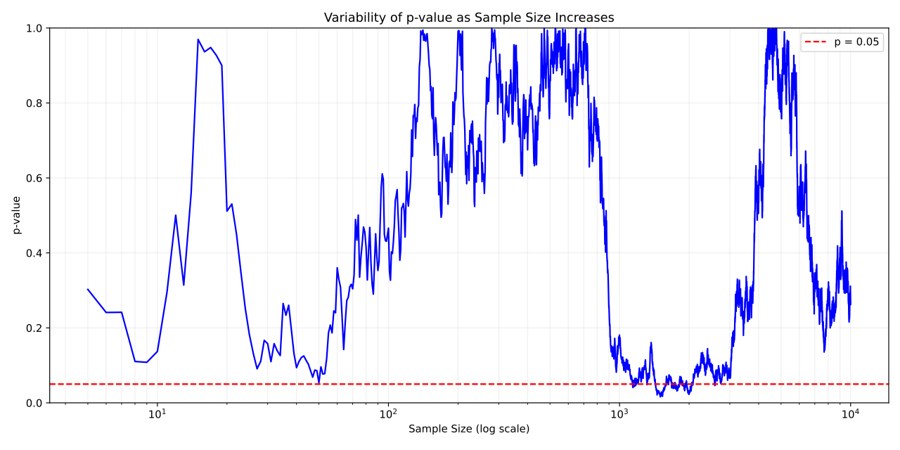
A team checks an A/B test every morning and stops the day the p-value first drops below 0.05. The overall false-positive rate will be:
Exactly 5%, because each look uses alpha = 0.05.
Lower than 5%, because early stopping saves data.
Zero if the effect is real.
Higher than 5%, because repeated looks give repeated chances for chance results.
Optional stopping inflates the Type I error rate. Fix the sample size beforehand or use a sequential method (alpha-spending, always-valid p-values) designed for repeated looks. Image: Cosmia Nebula, CC BY-SA 4.0, via Wikimedia Commons.
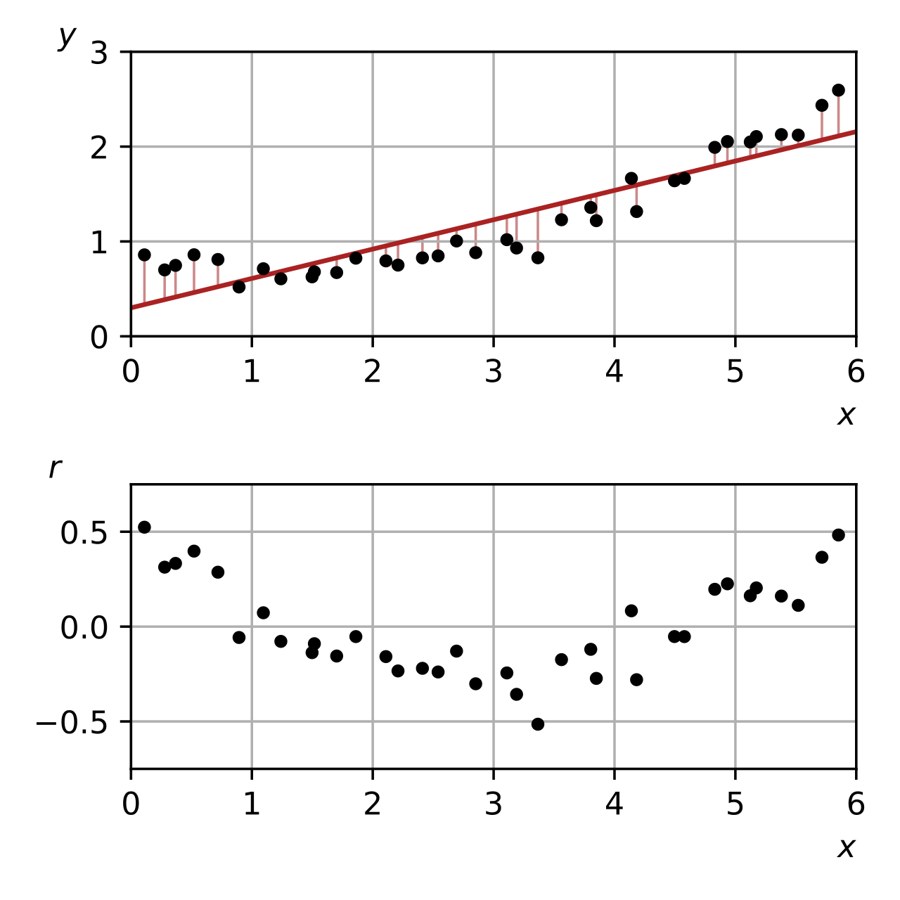
In the plot, which pattern of residuals indicates the straight-line model is a poor choice?
A random cloud around zero
The U-shaped (curved) pattern of residuals
Residuals with constant spread
Residuals of exactly zero for every point
A systematic curve means the model misses non-linear structure. Random scatter around zero with constant spread is what a well-specified linear model produces.
The residual plot fans out to the right as x grows. Which assumption is violated and what is the consequence?
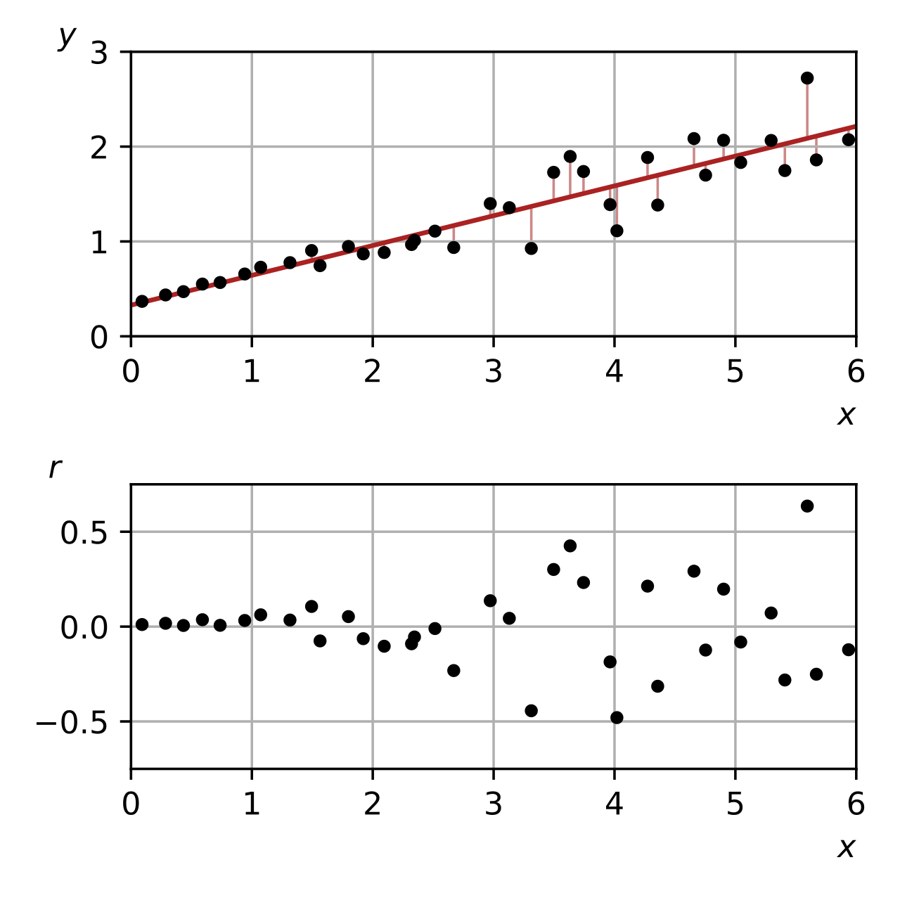
Equal variance; coefficients stay unbiased but standard errors and p-values are unreliable.
Linearity; the coefficients become biased.
Independence; R-squared must be above 0.9.
Normality of x; the model cannot be fit.
Fan or funnel shapes mean heteroscedasticity. OLS coefficients remain unbiased but the usual standard errors are wrong; use a log transform, weighted least squares or robust standard errors.
Adding a pure-noise predictor to a linear regression will:
Decrease R-squared.
Leave R-squared exactly unchanged in every case.
Always increase adjusted R-squared.
Never decrease R-squared, but can decrease adjusted R-squared.
R-squared cannot fall when a predictor is added (least squares can always set its coefficient to zero), so it rewards complexity. Adjusted R-squared penalizes extra predictors.
Ice cream sales and drowning deaths are strongly correlated across months. The best explanation is:
Ice cream causes drowning.
Drowning causes people to buy ice cream.
A confounder (hot weather) drives both.
The correlation must be a statistical error.
Summer heat raises both swimming and ice cream consumption. The correlation is real but not causal. Only randomization, or careful control of confounders, supports causal claims.
Hospital A has a higher overall survival rate than hospital B, but B has the higher survival rate for both mild and severe patients. A treats mostly mild cases. This is an example of:
Simpson's paradox
Regression to the mean
The ecological fallacy
Survivorship bias
The aggregate comparison is distorted by the different case mix (a lurking variable). Comparing within severity groups is the fair comparison.
The 10 worst-performing schools in a district get a new program, and next year their scores improve on average. Why can't you credit the program?
Because school scores never change.
Regression to the mean: extreme scores tend to move toward the average even without an intervention.
Because improvements always come from teachers.
Because the sample is too small to compute a mean.
Selecting on an extreme (bottom 10) partly selects bad luck, which does not repeat. You need a comparison group chosen the same way but without the program.
A fraud model flags transactions. Fraud is 0.1% of transactions, and the model catches 95% of fraud but also flags 2% of legitimate transactions. What fraction of flagged transactions are actually fraud?
About 95%
About 50%
About 2%
About 4.5%
Per 100,000 transactions: 100 are fraud (95 flagged); 99,900 are legitimate (1,998 flagged). Precision = 95 / (95 + 1,998), about 4.5%. The low base rate means false alarms from the huge legitimate group swamp the true detections.
Control: 120 conversions of 1,000 users. Variant: 150 of 1,000. Pooled proportion is:
0.12
0.15
0.135
0.0135
(120 + 150)/(1000 + 1000) = 270/2000 = 0.135. The pooled proportion is used in the standard error of the two-proportion z-test under H0 (both groups share one rate).
A/B test planned 50/50, but the dashboard shows 52,100 vs 47,900 users. Which is the right first reaction?
Ignore it, since the split is close to 50/50.
Run a chi-square sample ratio mismatch check; this deviation is too large for chance and suggests an assignment or logging bug.
Remove 4,200 users from the larger arm at random.
Declare the larger arm the winner.
With 100,000 users, a 52.1/47.9 split is far beyond random variation (about 13 standard errors). SRM means the randomization or tracking is broken, so any metric comparison is suspect.
Which test fits: comparing mean page load times for the same 40 pages before and after a code change?
Paired t-test
Independent two-sample t-test
Chi-square test of independence
One-way ANOVA with 40 groups
Each page is measured twice, so analyze the within-page differences. An independent test ignores the pairing and wastes power.
Which statement about bootstrapping is correct?
It resamples without replacement to avoid duplicates.
It needs the data to be normally distributed.
It resamples the observed data with replacement to estimate the variability of a statistic.
It generates new data from the null hypothesis only.
Bootstrap treats the sample as a stand-in for the population. It is distribution-free and works for statistics such as the median that have no simple formula.
Which situation calls for Benjamini-Hochberg rather than Bonferroni?
Running a single pre-registered primary test.
Comparing exactly two group means.
Checking the normality of residuals.
Screening 5,000 genes or features where you accept a small share of false discoveries in exchange for power.
Benjamini-Hochberg controls the false discovery rate and keeps far more power than Bonferroni when thousands of tests run. A single test needs no correction.
