Quiz · Hard
Multi-step problems on outlier fences, confidence intervals, standard error, base rates, multiple testing, chi-square, confounding, Simpson's paradox and A/B testing mistakes.
Data: 12, 15, 15, 18, 40. What are the mean and median?
Mean 20, median 15
Mean 18, median 15
Mean 15, median 20
Mean 20, median 18
Mean = 100 / 5 = 20. Median = middle value = 15. The 40 pulls the mean above the median.
A sample has Q1 = 10 and Q3 = 18. Which of these values is an outlier by the 1.5 x IQR rule?
2
-1
29
31
IQR = 8. Upper fence = 18 + 12 = 30; lower fence = 10 - 12 = -2. 31 > 30 is an outlier. 29, -1 and 2 are inside the fences.
A sample of n = 25 has mean 100 and SD 20. What is the approximate 95% CI for the population mean (use 1.96)?
96.1 to 103.9
80.8 to 119.2
98.0 to 102.0
92.2 to 107.8
SE = 20 / 5 = 4. Margin = 1.96 x 4 = 7.84. CI = 100 +/- 7.84 = (92.16, 107.84). The second option forgets to divide by sqrt(n).
How many times larger must the sample be to cut the standard error of the mean in half?
2 times
8 times
Cannot be done
4 times
. Halving SE needs to double, so n must quadruple.
A disease has 1% prevalence. A test has 90% sensitivity and 95% specificity. About what fraction of positive results are true positives?
About 90%
About 50%
About 95%
About 15%
Per 10,000 people: 100 sick, 90 test positive; 9,900 healthy, 5% = 495 test positive. PPV = 90 / (90 + 495) = 15.4%. Rare conditions give low PPV.
You run 10 independent tests at alpha = 0.05 and all null hypotheses are true. What is the probability of at least one false positive?
50%
About 40%
5%
About 10%
. This is why multiple comparisons need correction (e.g. Bonferroni, alpha = 0.005 per test).
The observed counts in a 2x2 table are 40, 10, 10, 40 and the expected counts are 25 each. What is chi-square, and is it significant at 5% (critical value 3.84, df = 1)?
18, not significant
1, not significant
9, not significant
36, significant
Each cell: (15)^2 / 25 = 9. Sum = 36 > 3.84, so the variables are significantly associated.
The correlation between hours studied and exam score is r = 0.6. What percentage of the variation in scores is explained by hours studied (linear model)?
6%
60%
36%
84%
. Choosing 60% confuses r with r squared.
Ice cream sales and drowning deaths are strongly correlated across months. The best explanation is:
Hot weather (a confounder) increases both
Ice cream causes drowning
The correlation must be a calculation error
Drowning causes ice cream sales
A third variable (temperature or season) drives both. Correlation alone cannot reveal causation.
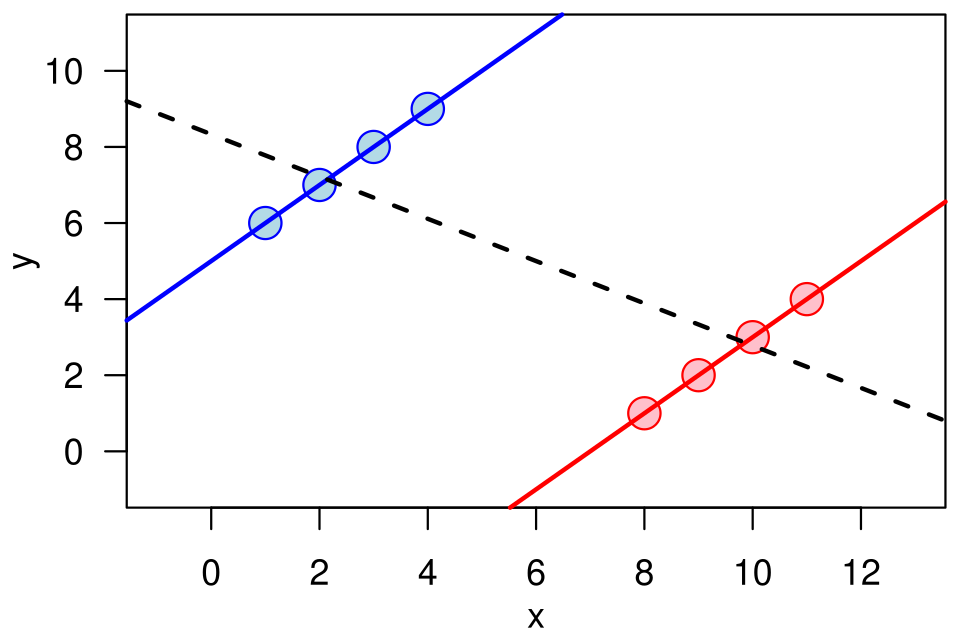
A treatment looks better than the control in every hospital separately, but worse when all hospitals' data are pooled. This is:
Regression to the mean
The central limit theorem
Simpson's paradox
A Type II error
A lurking variable (e.g. hospital size or case severity) is unevenly distributed across groups, so the pooled trend reverses.
An A/B test reaches p = 0.04 on day 3. The analyst stops the test early and declares a win. What is the problem?
p-values must be below 0.001
The sample is always too large
Peeking inflates the false positive rate; the sample size should be fixed in advance or sequential methods used
Nothing: p < 0.05 is enough
Repeatedly checking and stopping when p dips below 0.05 greatly raises the chance of a false positive.
Which statement about a 95% confidence interval of (48, 52) for a mean is correct?
95% of the individual observations lie in (48, 52)
The sample mean is 95% likely to be 50
The method produces intervals that contain the true mean in 95% of repeated samples
There is a 95% probability the true mean is in (48, 52)
The 95% refers to the long-run success rate of the procedure. It is not a probability statement about this one interval, and it is not about individual observations.
A data set has a right-skewed positive variable (e.g. income). Which transformation often makes it more symmetric?
Multiply by -1
Square it
Subtract the median
Take the logarithm
The log compresses large values and often yields a roughly symmetric distribution. Squaring would worsen the skew.
In a regression, the residual plot shows a clear U-shape against the fitted values. What does this indicate?
The data are normal
The linear model is appropriate
The sample is too large
The relationship is nonlinear; add a curve term or transform
Residuals should look like random noise. A systematic pattern means the model's form is wrong.
In SQL, SELECT COUNT(score) FROM exams returns 80 while SELECT COUNT(*) returns 100. What explains this?
20 duplicates exist
COUNT(score) counts distinct values
20 rows have NULL in score
The table has 80 columns
COUNT(column) ignores NULLs while COUNT(*) counts all rows, so 20 rows have a missing score.
