Quiz · Medium
Applied questions on SVMs, trees, boosting, clustering, PCA, regularization and evaluation, with figures to read. For intro ML and data science courses.
Which model is described as a 'lazy learner' because it does essentially no work at training time?
k-nearest neighbors
Naive Bayes
Logistic regression
Linear SVM
k-NN just stores the training data and does all the computation when a prediction is requested. Logistic regression, SVMs and naive Bayes all fit parameters during training.
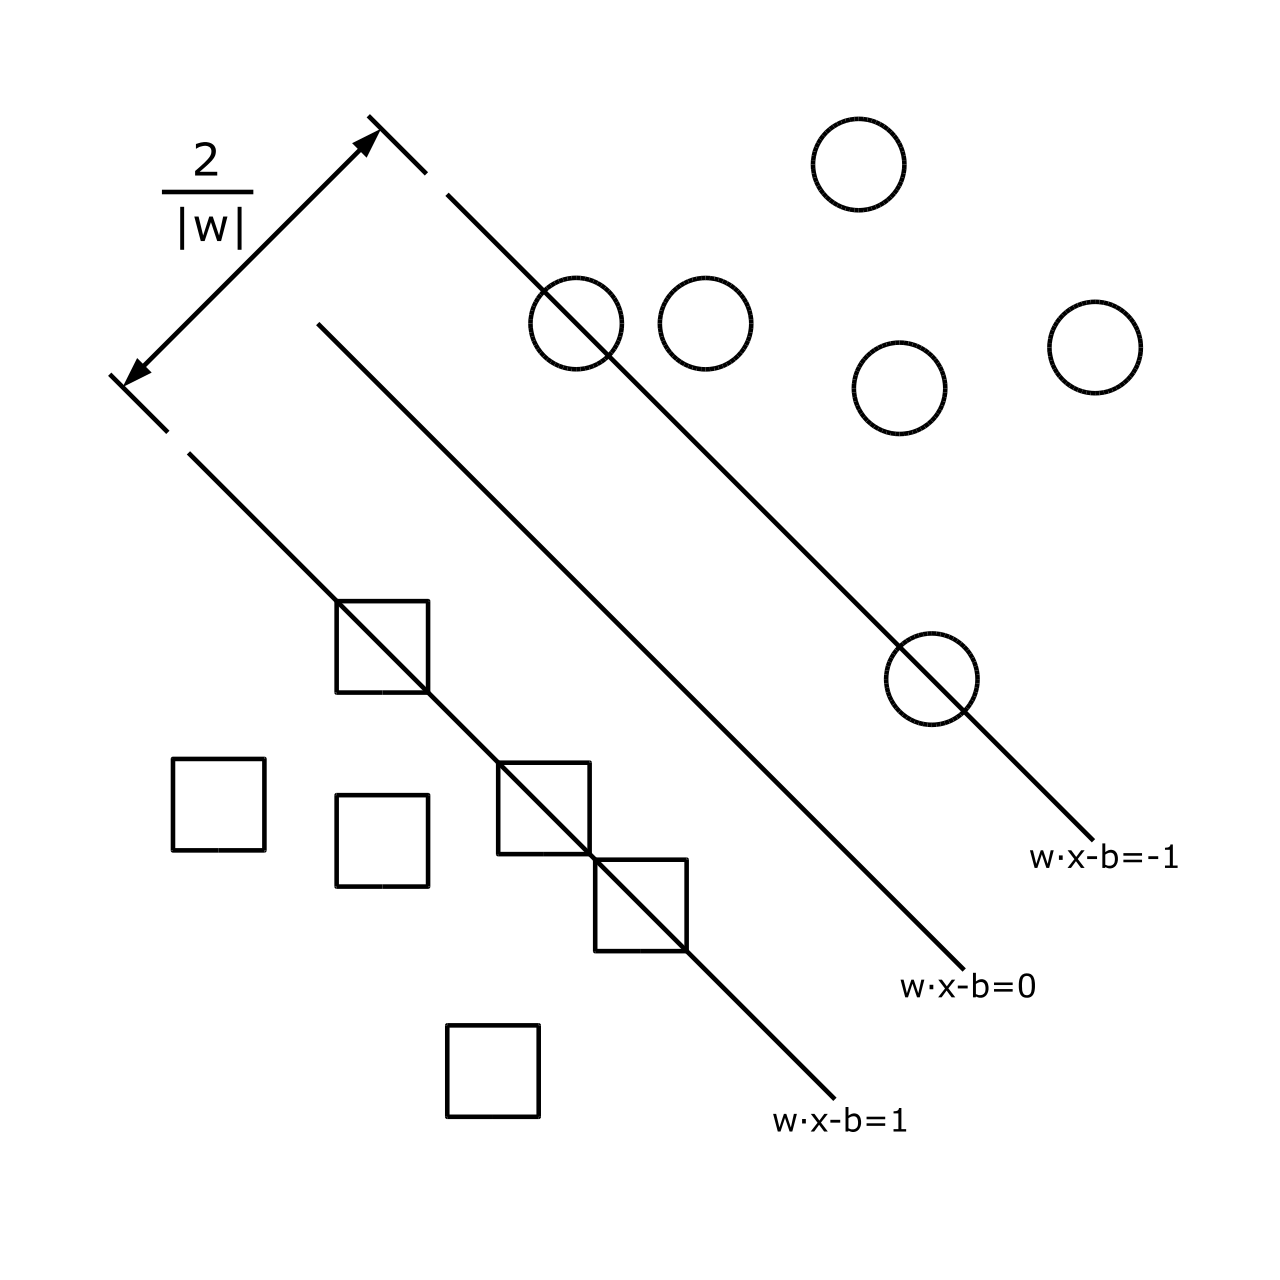
In the figure, what do the points lying exactly on the two outer lines (w·x - b = ±1) of a maximum-margin SVM represent?
Cluster centroids
Support vectors
Outliers that are removed before training
Points the model misclassified
Support vectors are the training points on (or inside) the margin. They alone determine the separating hyperplane; moving other points changes nothing.
A naive Bayes spam filter sees a word in a new email that never appeared in any spam in the training data. Without smoothing, what happens?
The spam probability becomes 0 for that email
The email is automatically classified as spam
The model raises the word's weight
The word is ignored
The unseen word has estimated probability 0 given spam, which multiplies the whole product to 0. Laplace smoothing adds a small count to avoid this. The wrong choice 'ignored' would only be true if the model were built to skip zero counts.
Which statement about random forests is correct?
Each tree sees a bootstrap sample and a random subset of features at each split
Every tree is trained on the full data with all features
They mainly reduce bias, not variance
Trees are trained one after another, each correcting the last
That randomness decorrelates the trees so averaging them lowers variance. Training trees sequentially on errors describes boosting.
Which pair is correctly matched?
Boosting trains independent models; bagging corrects errors
Both train models strictly in parallel
Bagging reduces bias; boosting reduces variance
Bagging trains models in parallel; boosting trains them sequentially
Bagging is parallel and mainly cuts variance. Boosting is sequential, each learner focusing on the previous ensemble's mistakes, and mainly cuts bias.
Why must features be standardized before running k-means?
Euclidean distance would be dominated by features with large numeric ranges
It automatically picks k
Standardizing removes outliers entirely
k-means only works on values between 0 and 1
A feature measured in thousands would swamp one measured in fractions when distances are computed. Scaling puts them on a common footing. It does not remove outliers or choose k.
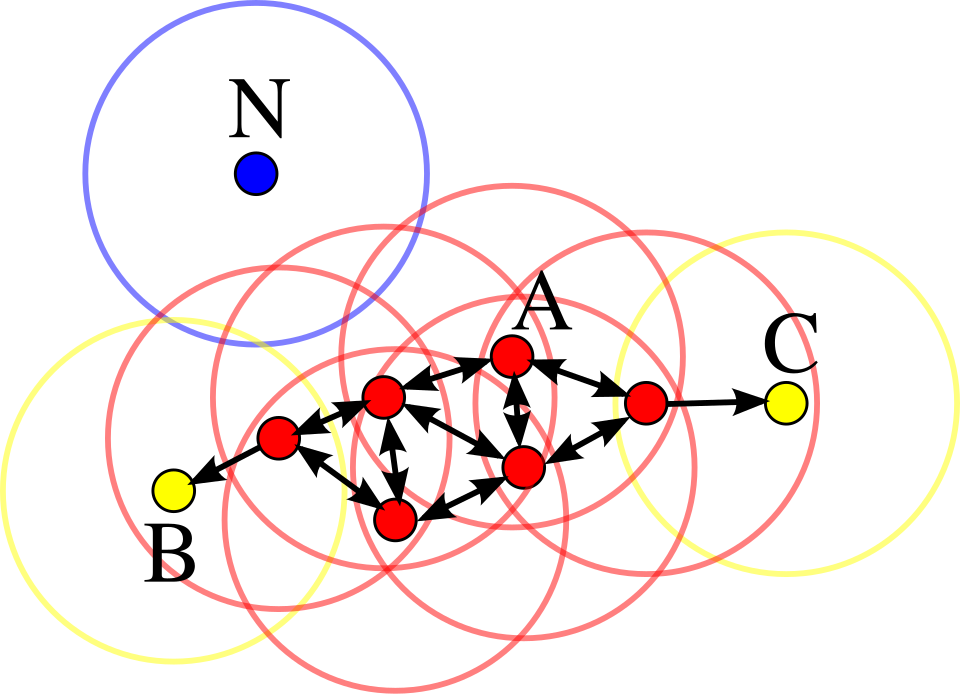
In this DBSCAN diagram, what is the blue point N?
A core point
A noise point
A cluster centroid
A border point
N has fewer than minPts neighbors within eps and is not within eps of any core point, so it is noise. Border points (yellow B and C) are within reach of a core point. Image: Chire, CC BY-SA 3.0, via Wikimedia Commons.
Which clustering algorithm can find clusters of arbitrary shape and flag outliers, without being told the number of clusters?
Gaussian mixture with fixed components
k-means
Hierarchical clustering with a fixed cut
DBSCAN
DBSCAN groups dense regions and marks sparse points as noise. k-means needs k and assumes round clusters.
What does the first principal component of the data in this plot represent?
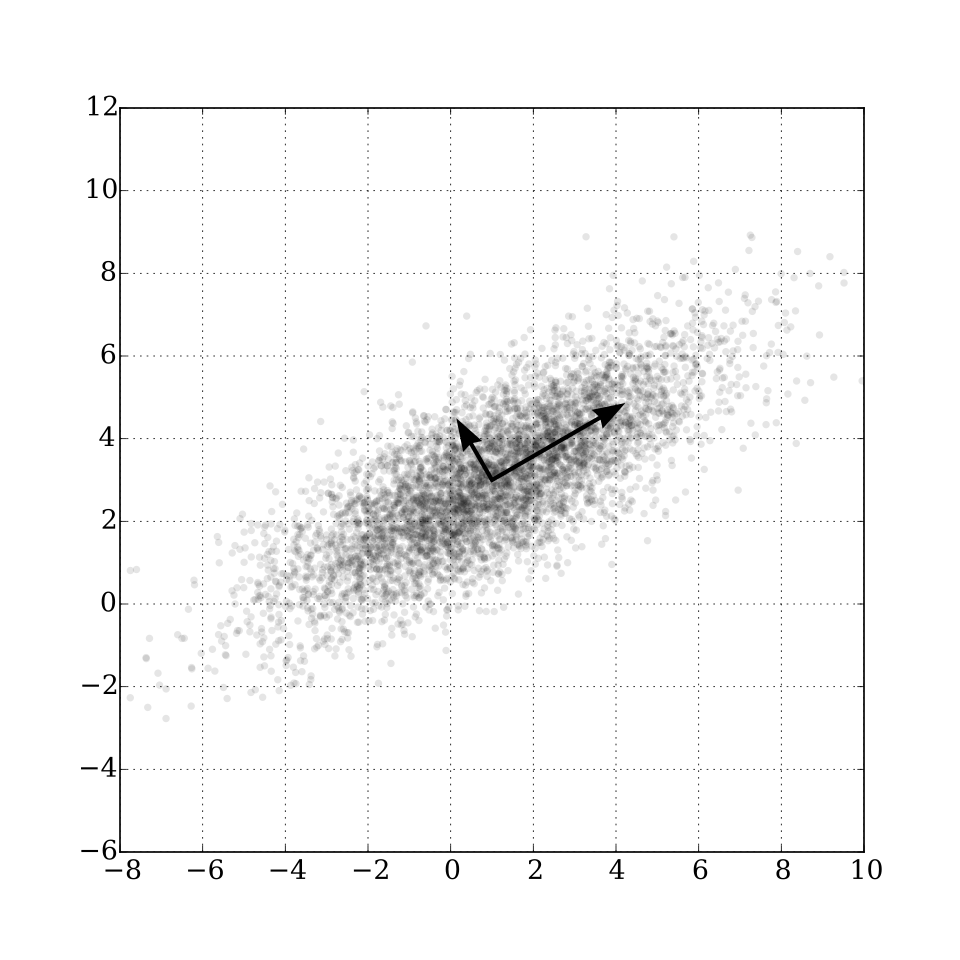
The direction of greatest variance
The mean of the data
A line through the class boundary
The direction along which the data vary the least
PC1 is the direction of maximum variance: here the long diagonal of the cloud. The second component is perpendicular to it and holds the next most variance. Image: Nicoguaro, CC BY 4.0, via Wikimedia Commons.
Which regularization method can drive some coefficients exactly to zero?
Ridge (L2)
Lasso (L1)
Neither: regularization only shrinks
Both equally
The L1 penalty has corners at zero that make sparse solutions likely. Ridge shrinks coefficients smoothly but rarely to exactly zero.
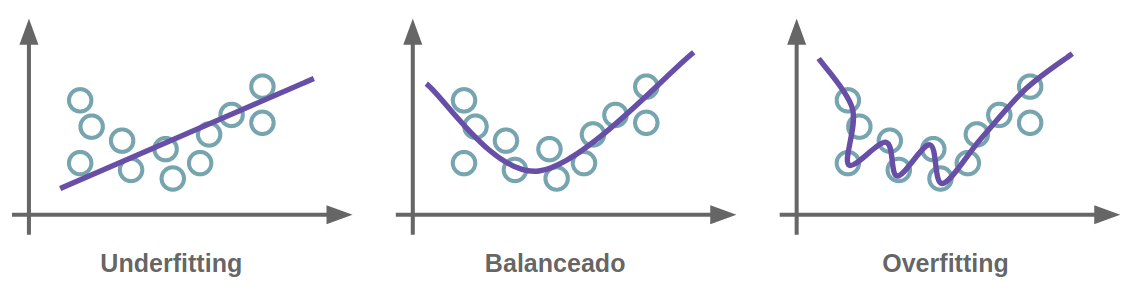
Looking at this figure, which panel shows overfitting?
Left (straight line)
Middle (smooth curve)
Right (wiggly curve through points)
None of them
The right-hand curve chases noise in every point: low training error, high variance. The left line is too simple (underfitting). Image: Leomaurodesenv, CC BY-SA 4.0, via Wikimedia Commons.
On the bias-variance plot, what happens to the Variance curve as model complexity increases?
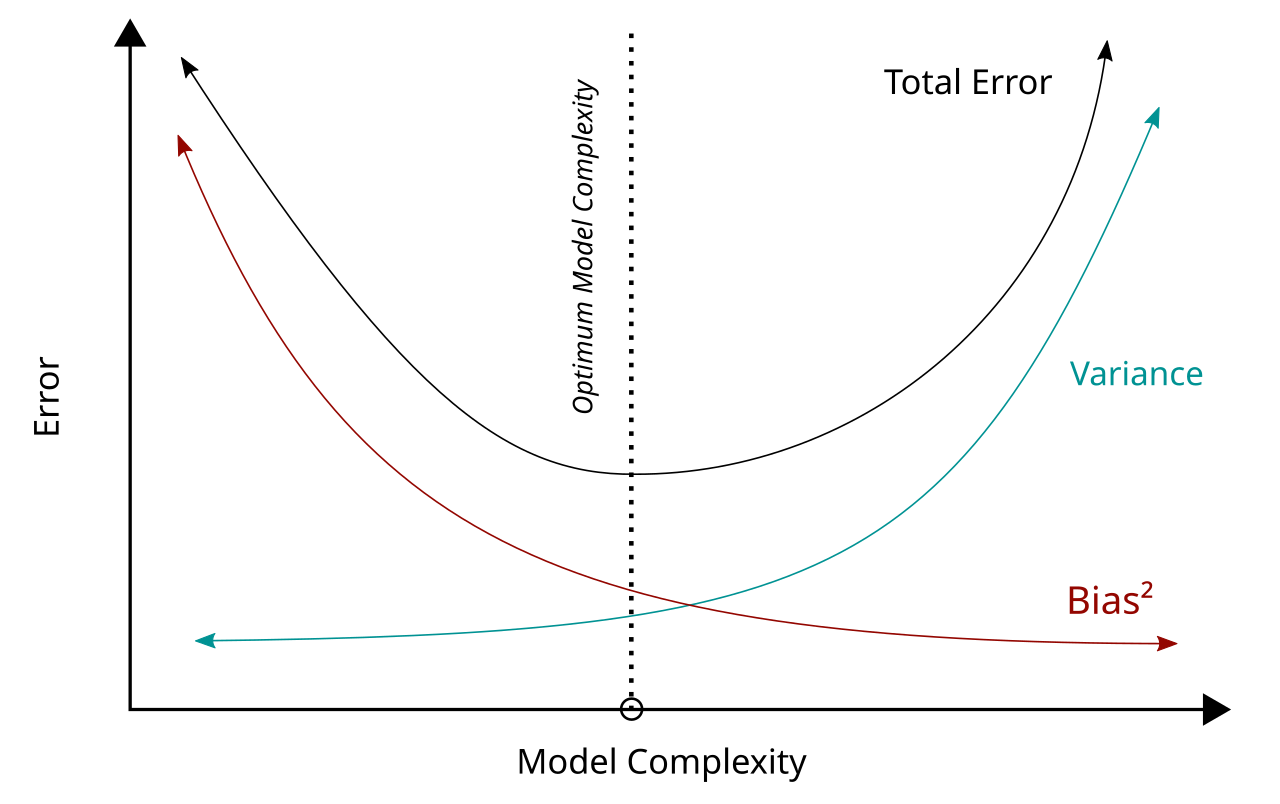
It rises
It first rises then falls
It stays flat
It falls
More flexible models are more sensitive to the particular training sample, so variance increases. Bias squared falls with complexity.
A model has AUC = 0.5. What does that mean?
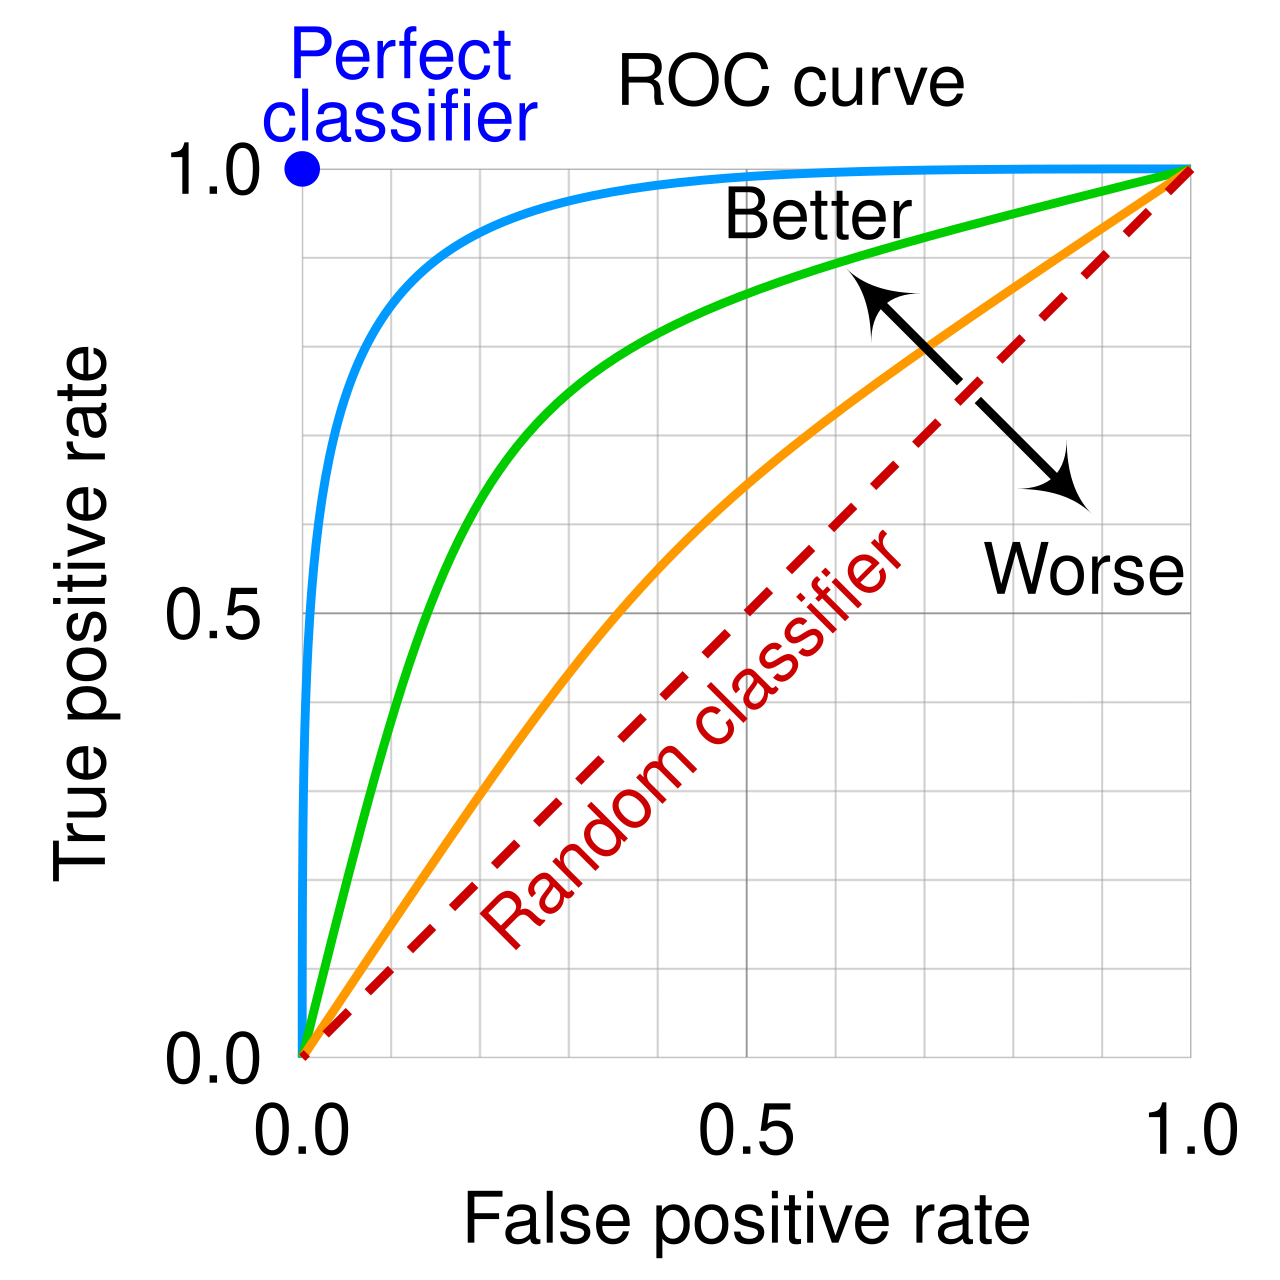
Its precision equals its recall
It is perfect
It is correct half the time on every class
It ranks no better than random guessing
AUC is the probability that a random positive gets a higher score than a random negative. 0.5 is chance (the diagonal of the ROC plot). Perfect is 1.0. Image: cmglee, MartinThoma, CC BY-SA 4.0, via Wikimedia Commons.
In the precision-recall diagram, which region lowers RECALL?
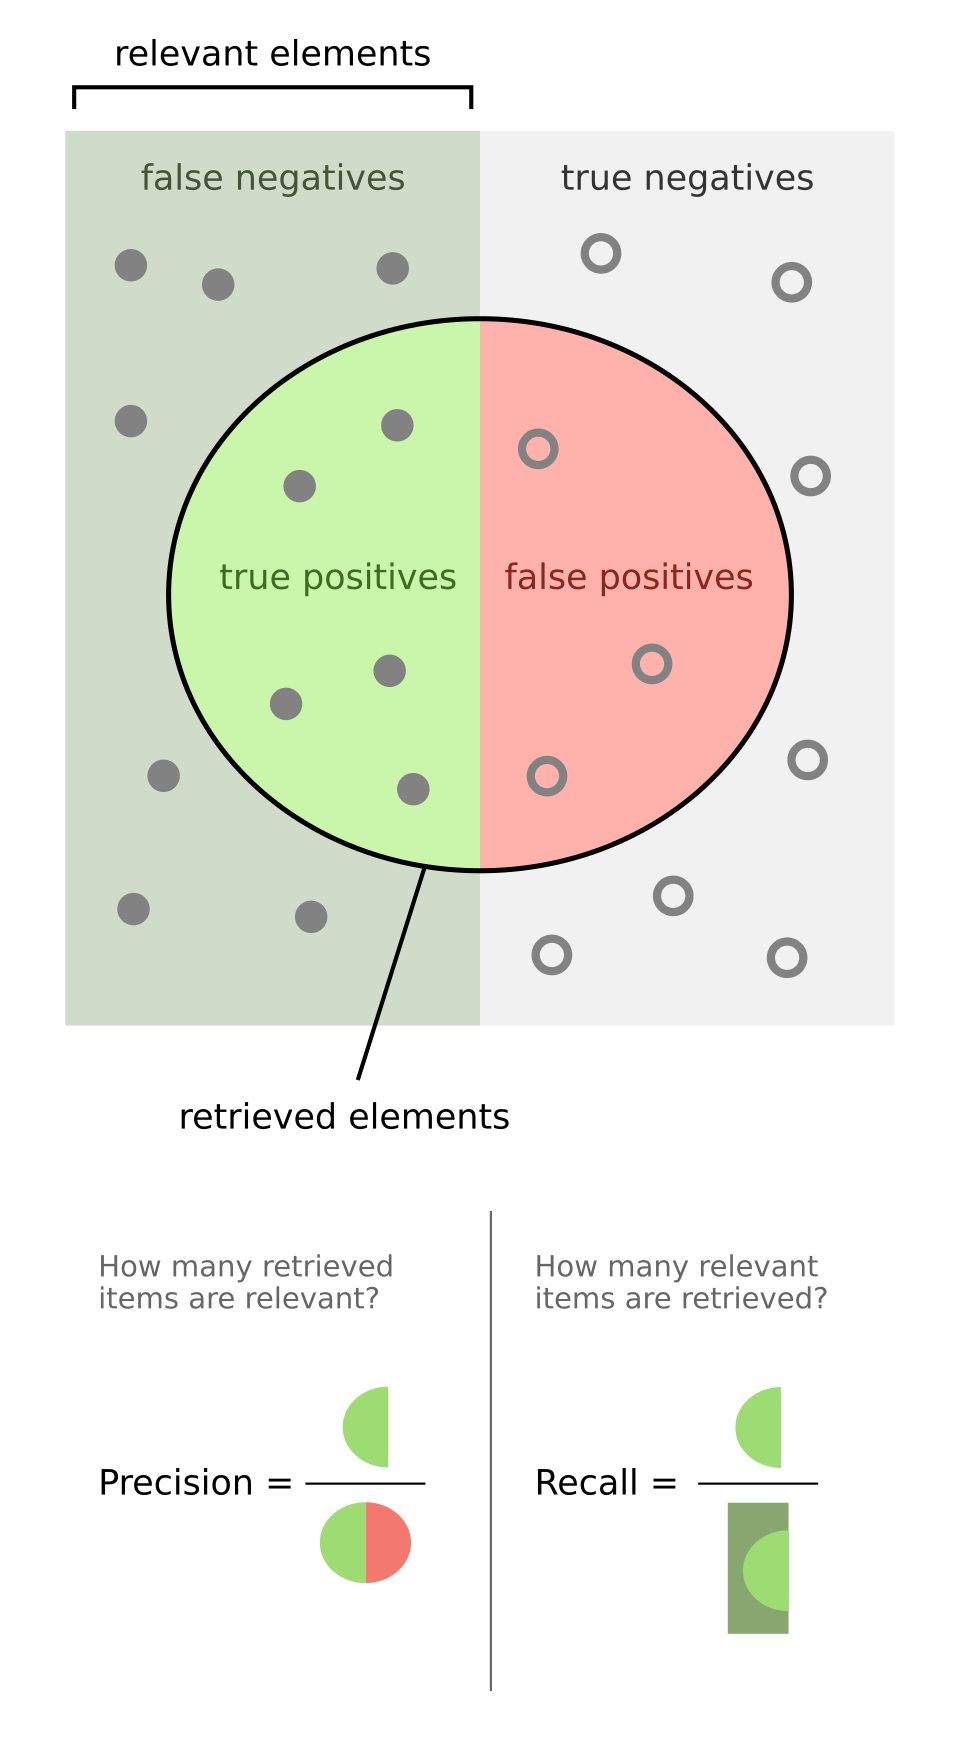
True positives
False positives
True negatives
False negatives
False negatives are relevant items that were not retrieved: recall = TP / (TP + FN). False positives lower precision instead. Image: Walber, CC BY-SA 4.0, via Wikimedia Commons.
You use 10-fold cross-validation. How many times does each observation serve as validation data?
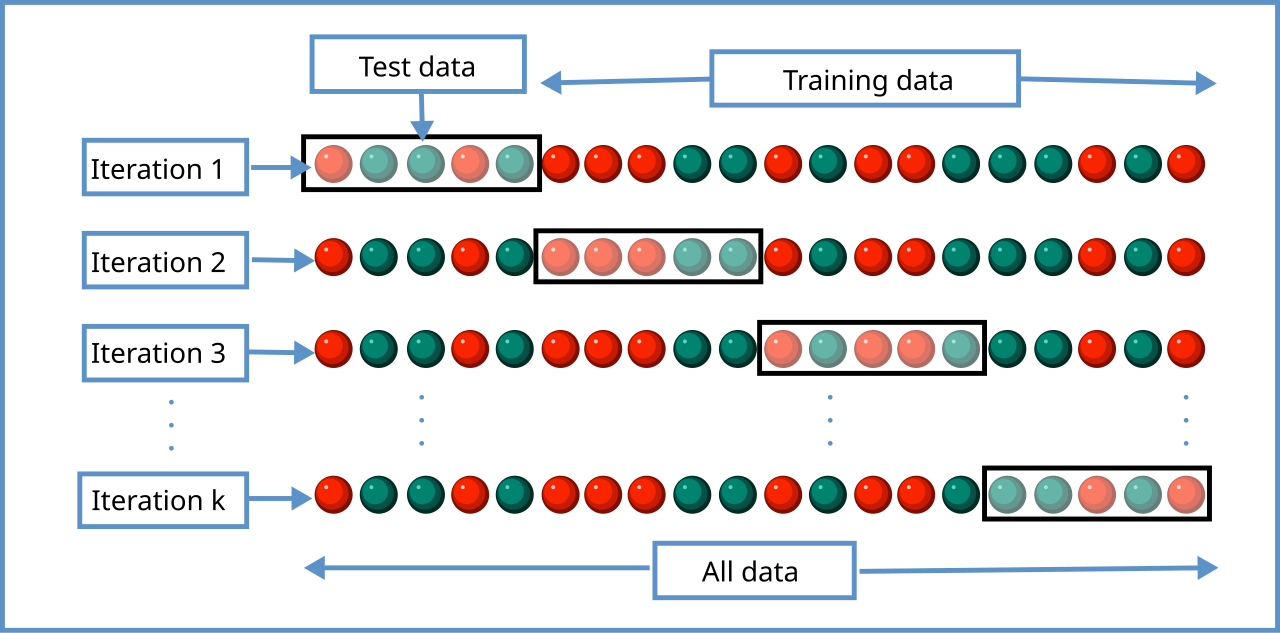
Nine times
Zero times, because only the test set is used for validation
Once
Ten times
Each observation is in exactly one validation fold (and in the training data for the other nine). The ten scores are averaged. Image: Gufosowa, CC BY-SA 4.0, via Wikimedia Commons.
Which of these is a data leakage mistake?
Fitting a scaler on the entire data set, then splitting
Evaluating on the test set once at the end
Standardizing using the training set's mean and standard deviation
Using stratified sampling for the split
Fitting the scaler on all the data lets information from the test rows influence preprocessing. Fit on training data only and apply to the rest.
A model for a rare disease should rarely miss a sick patient. Which metric should you prioritize?
Specificity
Accuracy
Recall (sensitivity)
Precision
Recall measures the share of sick patients detected. Accuracy would look great if the model predicted 'healthy' for everyone.
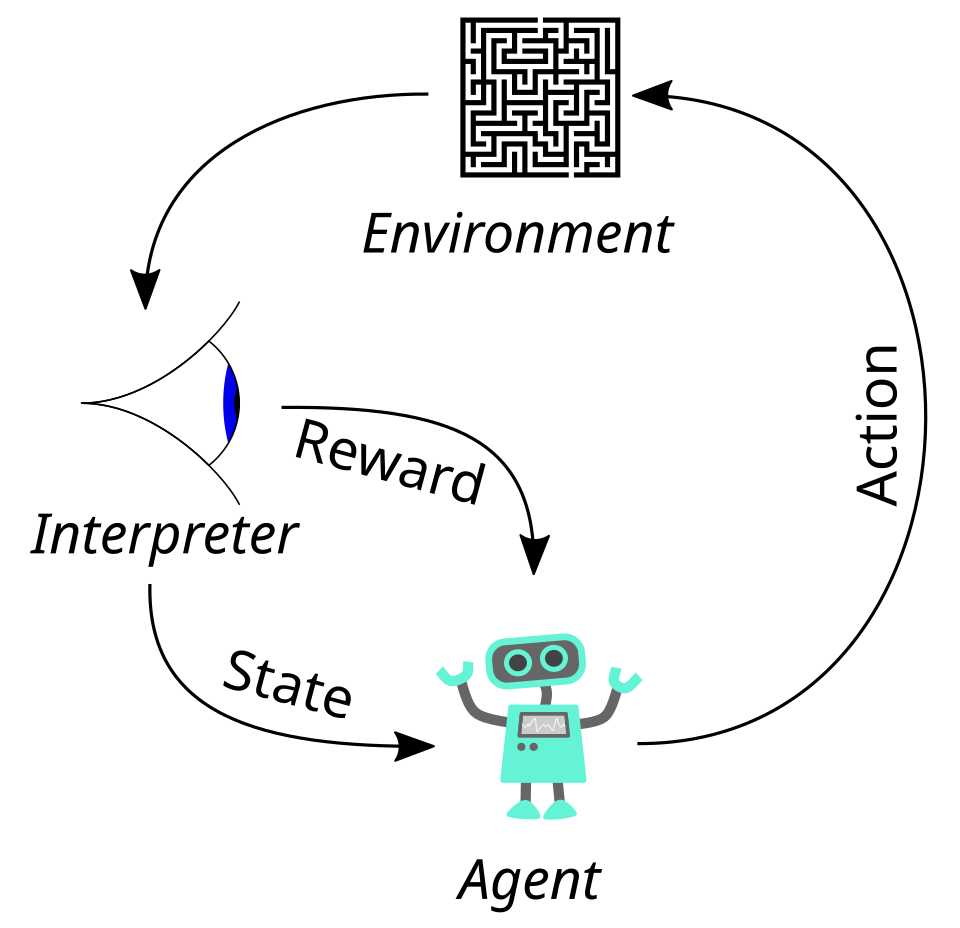
In reinforcement learning, what does the agent try to maximize?
The immediate reward only
The number of states visited
The prediction accuracy on labeled data
The cumulative (discounted) reward
The agent learns a policy that maximizes expected total reward over time, not just the next step. There are no labeled examples.
True or False: Logistic regression is mainly used to predict continuous numeric values.
True
False
False. It predicts class probabilities, so it is a classification algorithm despite the name. Linear regression predicts continuous values.
Which model would be LEAST affected if you did not scale the input features?
Support vector machine with RBF kernel
k-means
k-NN
Random forest
Tree splits only depend on the order of values within a feature. k-NN, SVMs and k-means all rely on distances.
A decision tree reaches 100% training accuracy but 72% test accuracy. Which change is most likely to help?
Limiting depth or pruning
Adding more identical copies of training rows
Growing the tree deeper
Removing the test set
The gap shows overfitting. Limiting depth, pruning or requiring larger leaves simplifies the model. Making it deeper worsens it; duplicate rows add no new information.
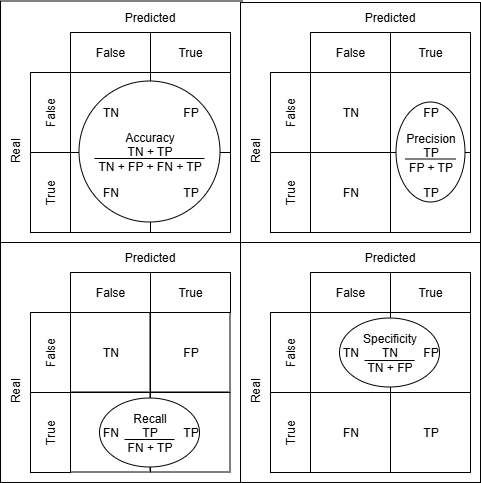
What does the oval in the bottom-left panel of this figure show?
Specificity
Recall
Precision
Accuracy
The oval covers the real-positive row: TP / (TP + FN), which is recall. Precision uses the predicted-positive column.
In gradient boosting, what does each new tree try to fit?
The original labels
A random subset of features
The residual errors (negative gradient) of the current ensemble
The average of all previous trees
Each tree is trained on what the ensemble still gets wrong, then added with a small learning rate. Fitting the original labels again would not improve the ensemble.
