Quiz · Medium
Axis, broadcasting, views vs copies, boolean masks, NaN handling, loc vs iloc, groupby transform, merges, safe assignment and performance.
What does this code print?
import numpy as np
a = np.arange(6).reshape(2, 3)
print(a.sum(axis=0), a.sum(axis=1))[ 3 12] [3 5 7]
[ 3 5 7] [15]
[3 5 7] [ 3 12]
[ 6 15] [3 5 7]
a is [[0,1,2],[3,4,5]]. axis=0 sums down the rows (one value per column: 3, 5, 7); axis=1 sums across columns (one per row: 3, 12).
What does this code print?
import numpy as np
col = np.array([[0], [10], [20]])
row = np.array([0, 1, 2, 3])
print((col + row).shape)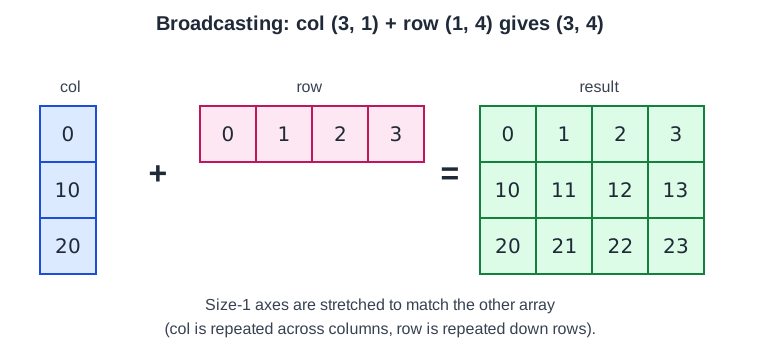
(3, 4)
(3, 1)
(4,)
It raises a shape mismatch error
A (3, 1) array and a (4,) array broadcast to (3, 4): the size-1 axis stretches, and the shorter shape is padded on the left to (1, 4).
What does this code print?
import numpy as np
a = np.arange(10)
b = a[2:5]
b[0] = 99
c = a[[2, 3]]
c[0] = -1
print(a[2])-1
2
3
99
The slice b is a view into a, so b[0] = 99 changed a[2]. The fancy-indexed c is a copy; changing it did not affect a.
What does this code print?
import numpy as np
a = np.array([5, 2, 8, 1])
print(a[a > 2], (a > 2).sum())[0 2] 2
[5 8] 2
[True False True False] 2
[5 8] 4
The boolean mask keeps elements greater than 2 (5 and 8); summing the mask counts the True values.
What does this code print?
import numpy as np
print(np.array([1, 2, np.nan]).mean(), np.nanmean([1, 2, np.nan]))1.5 1.5
nan nan
nan 1.5
1.5 nan
Any arithmetic with NaN gives NaN, so the plain mean is nan. np.nanmean ignores NaN values.
What does this code print?
import pandas as pd
s = pd.Series([1, None, 3])
print(s.dtype, s.mean(), s.isna().sum())int64 2.0 1
float64 2.0 1
float64 nan 1
float64 2.0 0
A missing value forces the column to float64. pandas' mean skips NaN by default, giving (1 + 3) / 2 = 2.0, and one value is missing.
What does this code print?
import pandas as pd
df = pd.DataFrame({"a": [1, 2, 3], "b": [10, 20, 30]}, index=["x", "y", "z"])
print(df.loc["x":"y"].shape, df.iloc[0:1].shape)
(2, 2) (1, 2)
(1, 2) (1, 2)
(2, 2) (2, 2)
(1, 2) (2, 2)
loc slices by label and includes the end label (rows x and y); iloc slices by position and excludes the end (only row 0).
What does this code print?
import pandas as pd
df = pd.DataFrame({"g": ["a", "b", "a"], "v": [1, 2, 5]})
print(df.groupby("g")["v"].transform("mean").tolist())[3.0, 2.0]
[2.0, 2.0, 2.0]
[1.0, 2.0, 5.0]
[3.0, 2.0, 3.0]
Group a has mean 3.0 (1 and 5) and group b has mean 2.0 (just 2). transform returns one value per original row, aligned with the input, so the list has 3 items.
What does this code print?
import pandas as pd
df = pd.DataFrame({"k": [1, 2, 3], "v": ["a", "b", "c"]})
r = pd.DataFrame({"k": [2, 3, 4], "w": [20, 30, 40]})
print(df.merge(r, on="k").shape, df.merge(r, on="k", how="left").shape)(3, 3) (3, 3)
(2, 3) (2, 3)
(2, 3) (3, 3)
(3, 3) (2, 3)
The default inner merge keeps keys 2 and 3 (2 rows); a left merge keeps all three left keys (3 rows). Each result has the 3 columns k, v and w.
What does this code print?
import pandas as pd
df = pd.DataFrame({"a": [1, 2, 3]})
df.loc[df.a > 1, "a"] = 0
print(df.a.tolist())
[1, 0, 0]
[1, 2, 3]
[0, 0, 0]
[1, 2, 0]
A single .loc[mask, column] = value call updates the original DataFrame for the selected rows. Chained assignment (df[df.a > 1]["a"] = 0) does not.
What does this code print?
import pandas as pd
df = pd.DataFrame({"c": ["x", "y", "x", "x"]})
print(df.c.value_counts(normalize=True).to_dict()){'x': 3, 'y': 1}
{'x': 0.5, 'y': 0.5}
{'x': 1.0, 'y': 0.0}
{'x': 0.75, 'y': 0.25}
value_counts(normalize=True) returns proportions: 3 of 4 rows are 'x' (0.75) and 1 of 4 is 'y' (0.25).
An integer column is brought in by a left merge and some rows have no match. What happens to the column's dtype?
It stays int64 and missing values become 0
It is converted to float because NaN cannot be stored in a NumPy integer column
It becomes str automatically
pandas raises an error
Missing values are NaN (a float), so pandas upcasts the whole column to float64. Convert afterward with the nullable Int64 dtype if you need integers and missing values.
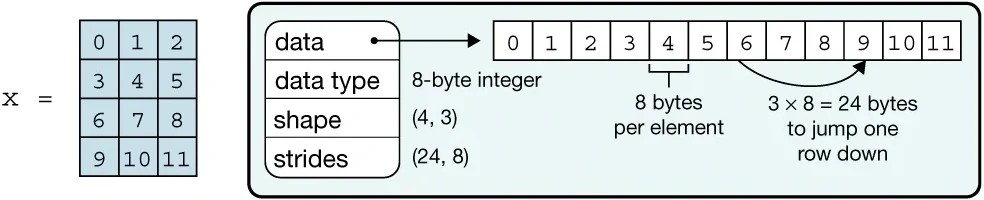
The array x in the figure has shape (4, 3) and 8-byte integers. What are its strides in bytes?
(8, 24)
(4, 3)
(24, 8)
(12, 3)
Moving one row down skips 3 columns x 8 bytes = 24 bytes; moving one column right skips 8 bytes. NumPy stores rows contiguously (C order) by default. Image: Charles R. Harris et al., CC BY-SA 4.0, via Wikimedia Commons.
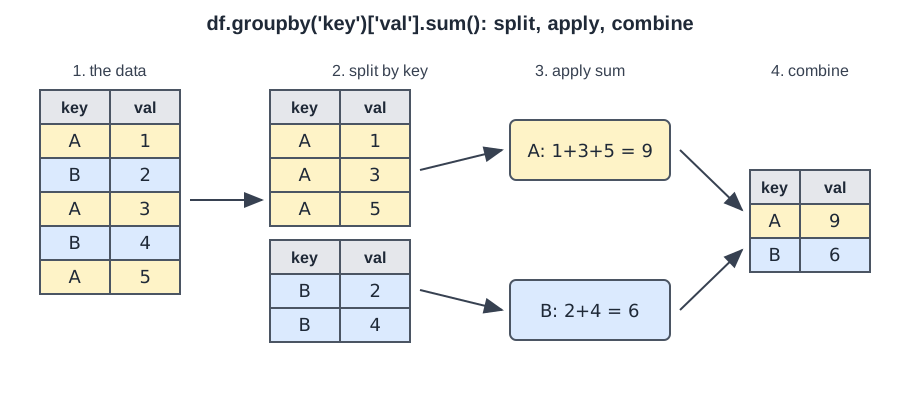
Which pandas call produces the result shown by the group-and-combine figure (one row per key with the sum of val)?
df.groupby('key')['val'].transform('sum')
df.groupby('key')['val'].sum()
df.sort_values('key')['val'].sum()
df.pivot('key')['val']
groupby(...).sum() reduces each group to one row. transform('sum') would return the group sum repeated on every original row (5 rows), not the 2-row summary.
A DataFrame method chain uses df.apply(f, axis=1) on 5 million rows and is very slow. What is the best fix?
Rewrite f as vectorized column operations (or np.where / np.select)
Use more RAM
Replace apply with a for loop over df.iterrows()
Convert the DataFrame to a list of dicts first
apply with axis=1 calls a Python function per row, so it is limited by Python-loop speed. iterrows is even slower. Vectorized operations run in compiled code.
