Quiz · Medium
Measures of center and spread, outliers, distributions, hypothesis-testing logic, chart choice, missing data and everyday pandas and SQL, with figures to read.
Five incomes (in thousands) are 30, 32, 35, 38 and 400. Which measure best describes a typical income?
Median
Range
Standard deviation
Mean
The median (35) is not distorted by the extreme 400. The mean (107) is pulled far above what most people earn. Range and SD measure spread, not a typical value.
In the right-hand panel, which statement about the mean, median and mode is correct?
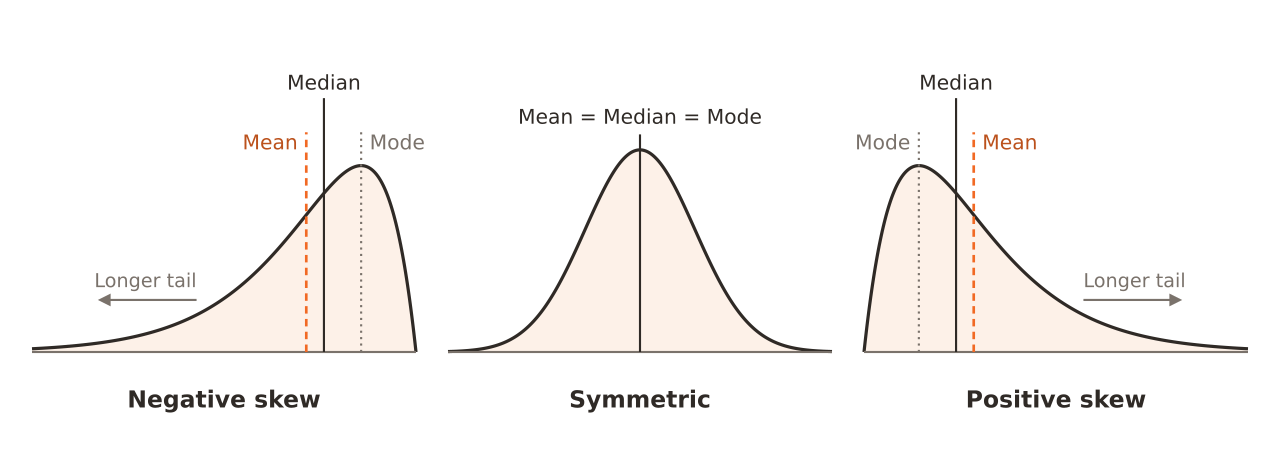
Mean < median < mode
Mean = median = mode
Median < mode < mean
Mode < median < mean
In positive (right) skew the long right tail drags the mean up the most, with the median in between and the mode at the peak. Image: Derek Jansen, CC BY 4.0, via Wikimedia Commons.
A box plot has Q1 = 21 and Q3 = 33. A data point of 60 is plotted. Is it flagged as an outlier by the 1.5 x IQR rule?
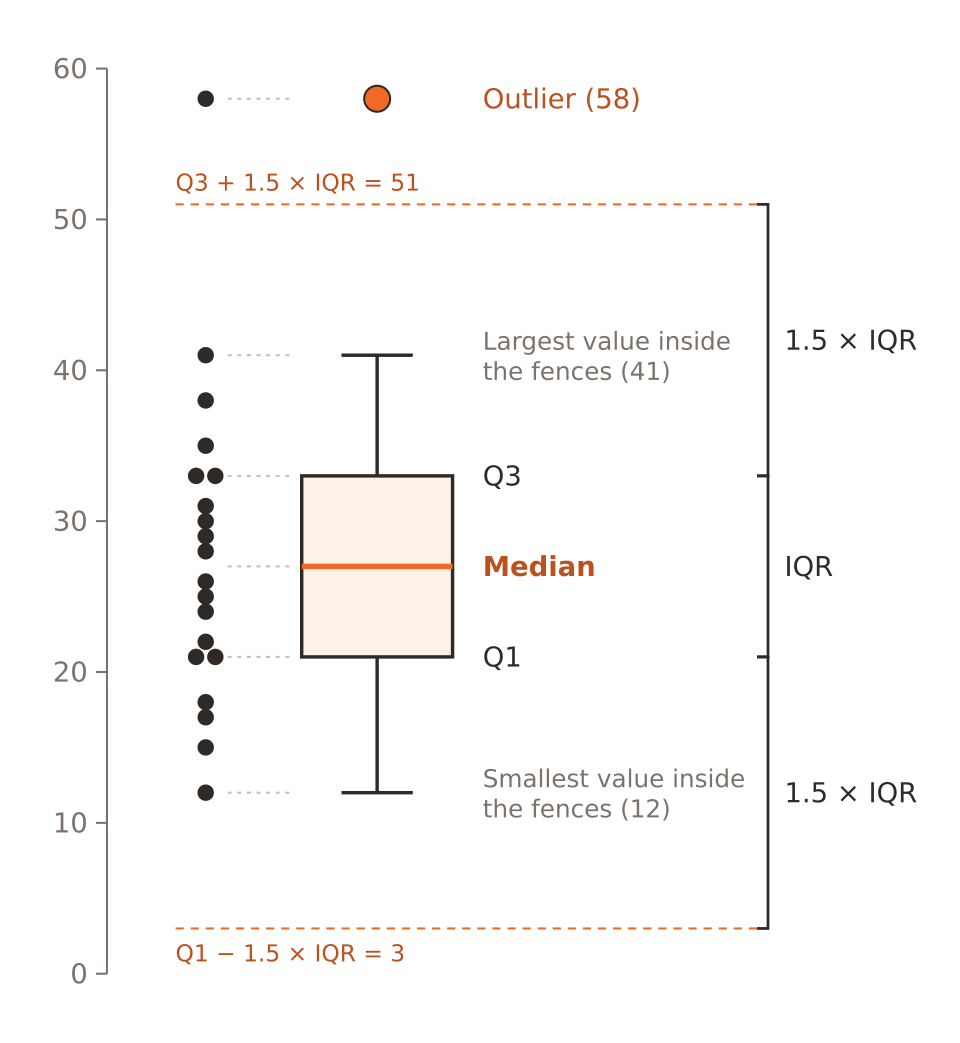
No, because 60 is less than 3 x IQR
Only if it is the maximum
Yes, because 60 > 33 + 1.5 x 12 = 51
No, because outliers need z-scores
IQR = 12, so the upper fence is 33 + 18 = 51. Anything above 51 is flagged. 60 exceeds it. Image: Derek Jansen, CC BY 4.0, via Wikimedia Commons.
Which variable is measured on an ordinal scale?
Weight in kilograms
Temperature in Celsius
Customer satisfaction: poor, fair, good, excellent
Hair colour
Ordinal data have a natural order but unequal or unknown spacing. Hair colour is nominal; temperature is interval; weight is ratio.
Test scores are approximately normal with mean 70 and SD 10. About what proportion of scores are between 60 and 80?
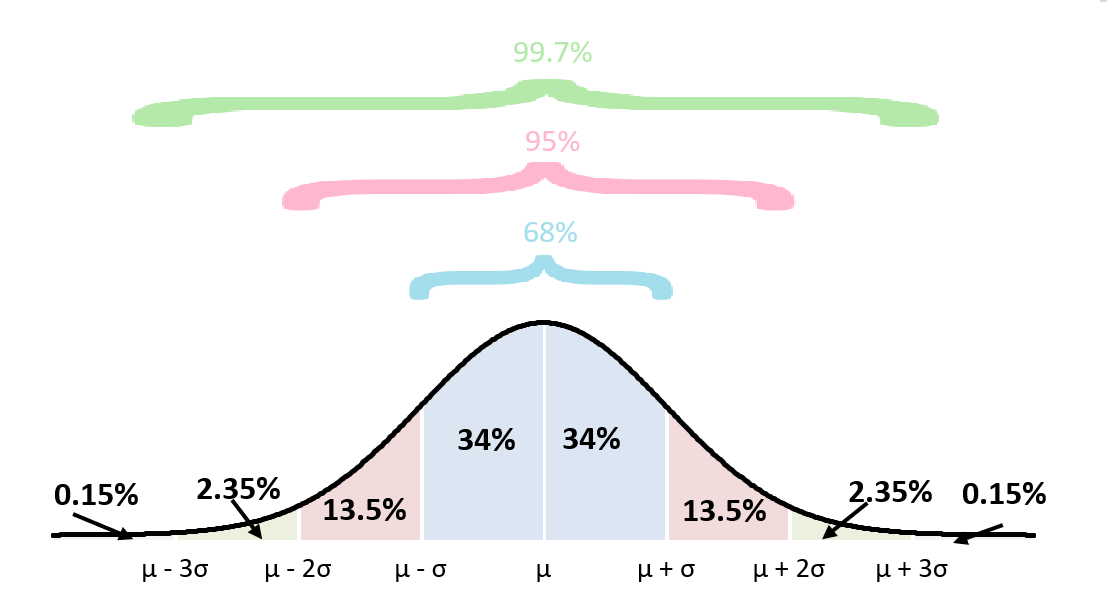
99.7%
95%
50%
68%
60 and 80 are one standard deviation either side of the mean: about 68%. Image: Holschrk, CC BY-SA 4.0, via Wikimedia Commons.
A student scores 85 on a test with mean 70 and SD 10. What is the z-score?
15
1.5
8.5
0.15
: 1.5 standard deviations above the mean. 15 is the raw difference.
A study reports p = 0.03. Which interpretation is correct?
The effect is large
If the null hypothesis were true, data this extreme or more would occur about 3% of the time
97% of the time the result will replicate
There is a 3% chance the null hypothesis is true
A p-value is a probability of the data given H0, not a probability of H0. It also says nothing about effect size or replication.
Which is a Type I error?
Using the wrong chart
Rejecting a true null hypothesis
Failing to detect a real effect
Choosing a sample that is too large
A Type I error is a false positive, with probability alpha. Failing to detect a real effect is a Type II error.
How does increasing the sample size (same data variability) affect the standard error of the mean?
It stays the same
It decreases
It increases
It becomes zero
shrinks as n grows. It never becomes exactly zero unless the entire population is measured.
What do these panels demonstrate as n increases from 2 to 30?
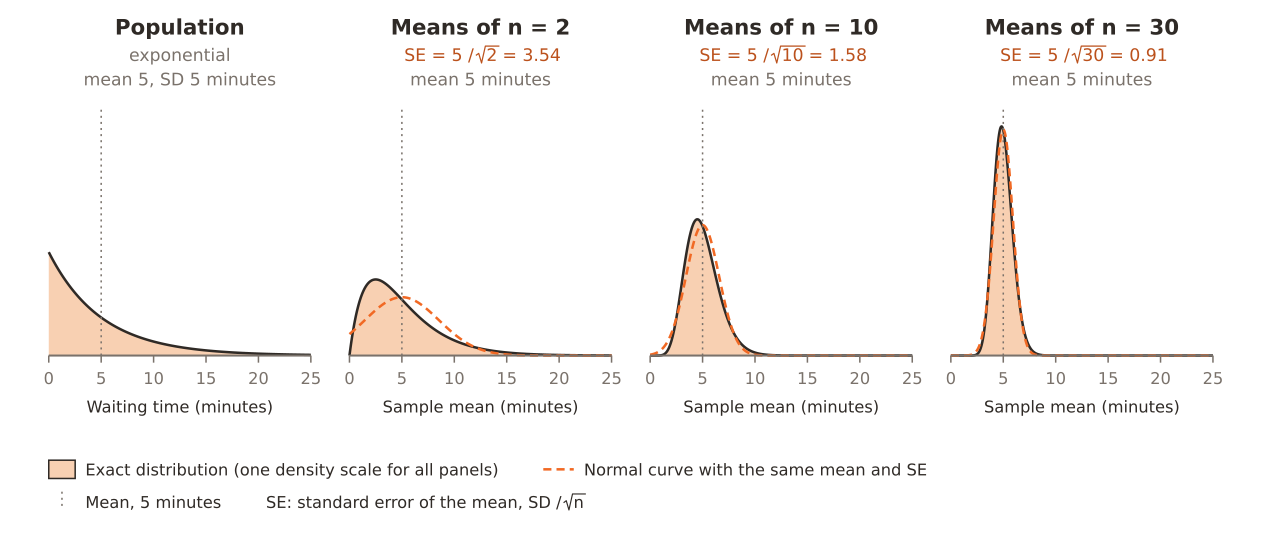
The population becomes normal
The standard deviation of the population shrinks
The distribution of sample means approaches a normal curve with smaller spread
The mean of the sample means changes
That is the central limit theorem. The population itself is unchanged (still exponential) and the mean of the sample means stays at 5. Image: Derek Jansen, CC BY 4.0, via Wikimedia Commons.
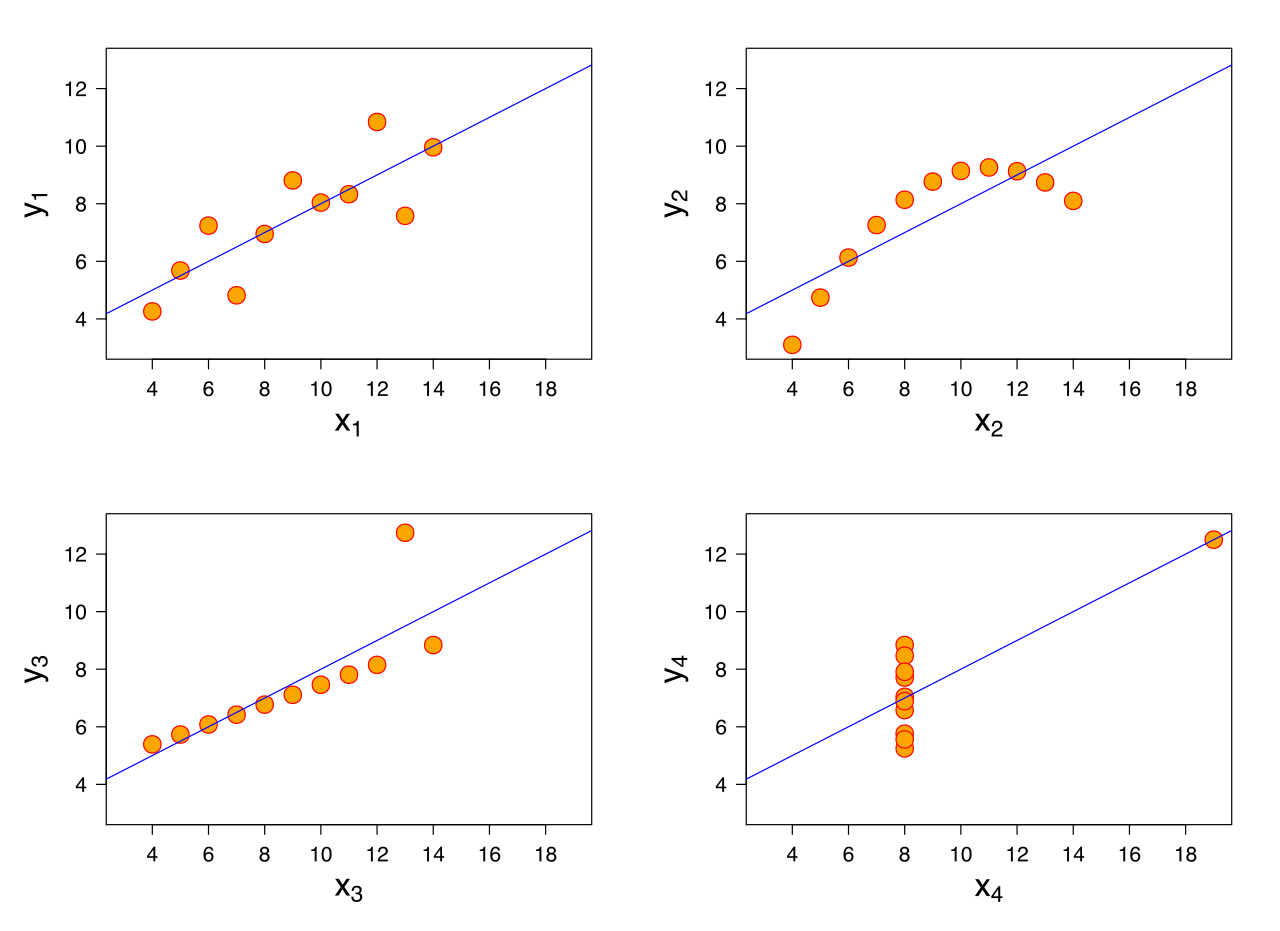
Anscombe's quartet shows four data sets with the same mean, variance and correlation. What is the main lesson?
Correlation is always reliable
Regression lines are never useful
You should visualize the data, not rely on summary statistics alone
Outliers should always be deleted
The four plots look completely different (a line, a curve, an outlier, a leverage point) yet share the same summaries. Image: Schutz (Anscombe.svg), subscripts by Avenue, CC BY-SA 3.0, via Wikimedia Commons.
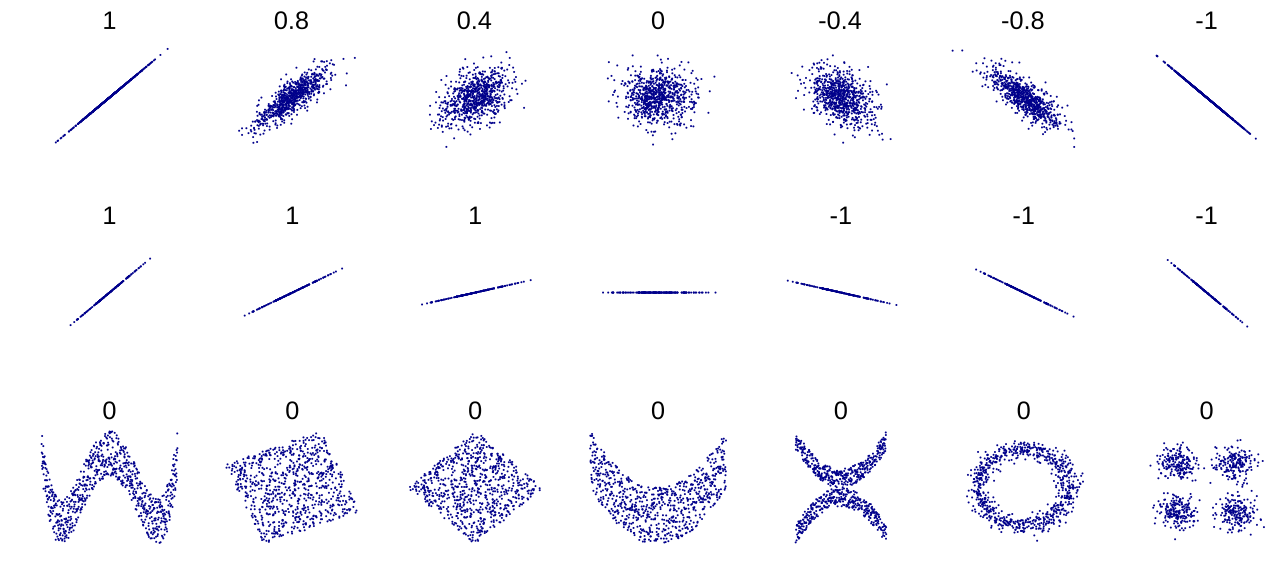
The figure shows a correlation of 0 for a ring-shaped scatter plot. What does that mean?
The data are random
The variance is zero
There is no LINEAR relationship; a nonlinear pattern can still exist
There is no relationship at all
Pearson's r detects only linear association. The ring has a strong, clearly structured, nonlinear relationship but r = 0.
Which chart best shows the distribution of a single numeric variable such as age?
Histogram
Pie chart
Stacked bar chart
Line chart of the ids
A histogram bins a numeric variable and shows its shape. Pie and stacked bar charts show parts of a whole; a line chart shows a trend over time.
A bar chart's y-axis starts at 50 instead of 0, making a small difference look huge. What is the problem?
The chart should be a pie chart
A truncated axis exaggerates differences because bar length encodes the value
The bars are too wide
Nothing, axes can start anywhere for bars
For bar charts the bar length must be proportional to the value, so the axis should start at zero. Line charts can use a truncated axis.
In 40% of survey records the income field is blank, and people with high incomes are less likely to answer. What type of missingness is this?
MNAR
MCAR
Not missing
MAR
The probability of being missing depends on the missing value itself (high income), so it is missing not at random. Simply dropping those rows would bias the results.
Which test would you use to compare mean blood pressure of the same patients before and after a treatment?
One-way ANOVA with three groups
Paired t-test
Chi-square test
Independent two-sample t-test
Before and after measurements on the same subjects are paired. An independent test would ignore this pairing and lose power.
In a table of two categorical variables, which test checks whether they are independent?
Linear regression
Paired t-test
Pearson correlation
Chi-square test of independence
The chi-square test compares observed counts with the counts expected under independence. Correlation and t-tests need numeric variables.
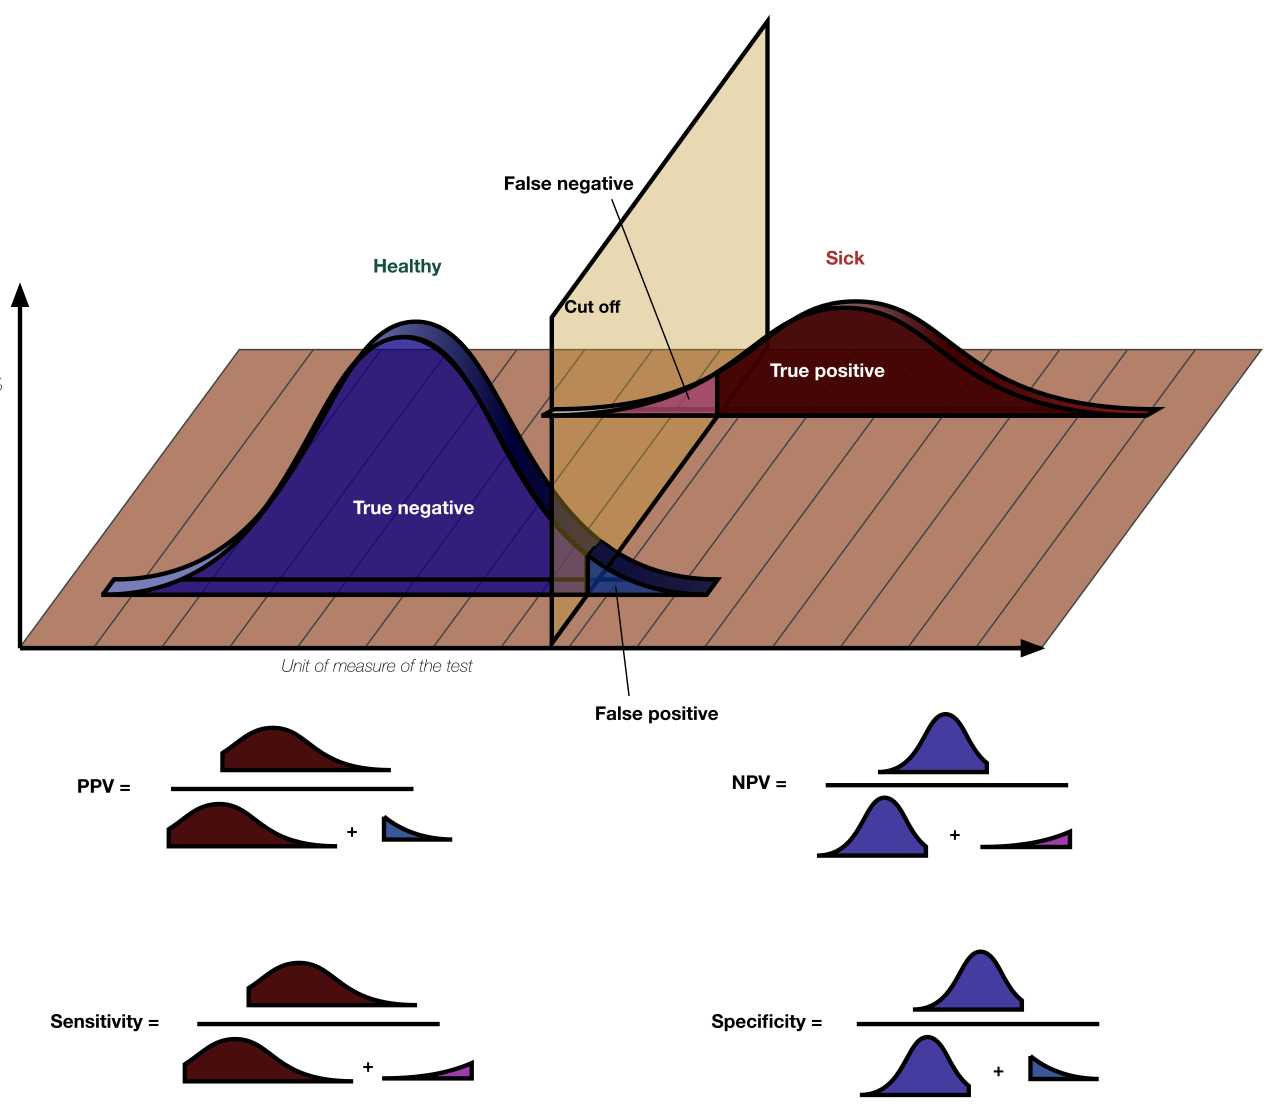
In this figure, what happens to the number of false negatives if the cut off is moved to the left?
It stays the same
It becomes equal to the false positives
It increases
It decreases
A lower threshold labels more sick people as positive, so fewer are missed (false negatives fall) but more healthy people are flagged (false positives rise). Image: Original by Luigi Albert Maria, CC BY-SA 4.0, via Wikimedia Commons.
A pandas user writes: df[df['age'] > 30]['flag'] = 1 and nothing changes in df. Why?
flag must be a string
The age column must be sorted first
Chained indexing assigns to a temporary copy; use df.loc[df['age'] > 30, 'flag'] = 1
pandas can't assign integers
The first bracket returns a copy, so the assignment modifies the copy and df is unchanged. A single loc call modifies df.
SQL: which clause filters on an aggregate such as SUM(amount) > 1000?
WHERE
ORDER BY
HAVING
LIMIT
WHERE runs before grouping, so it cannot see aggregates. HAVING filters groups after aggregation.
True or False: A statistically significant result always means the effect is large and important.
True
False
False. With a very large sample even a trivial difference can be significant. Check the effect size and confidence interval too.
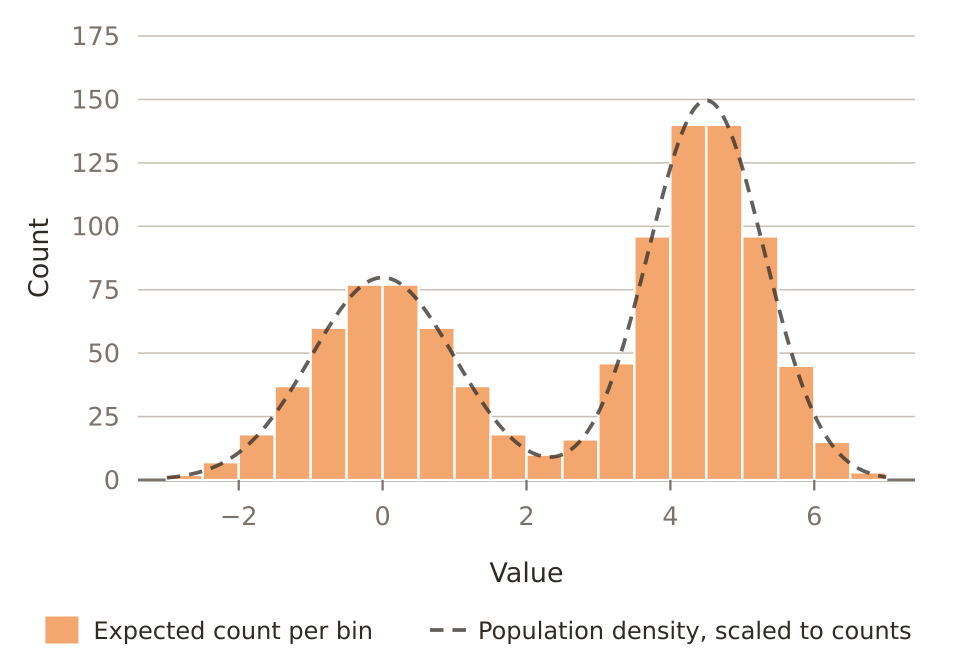
A bimodal histogram of customer spending most likely suggests:
The data are normally distributed
A measurement error in every record
That the median equals the mean
Two distinct customer groups mixed together
Two peaks usually mean two subpopulations (e.g. casual and heavy buyers) that should be analyzed separately. Image: Derek Jansen, CC BY 4.0, via Wikimedia Commons.
