StudyFox
कीमतेंब्लॉगएक्सटेंशनमुफ़्त टूल
  • कीमतें
  • ब्लॉग
  • एक्सटेंशन
  • मुफ़्त टूल
  • शुरू करेंसाइन इन
StudyFox

अपने नोट्स, PDF और स्लाइड्स को फ़्लैशकार्ड, क्विज़, नोट्स और माइंड मैप में बदलें।

StudyFox खोलें

स्टडी टूल्स

  • होमवर्क हेल्पर
  • नोट मेकर
  • फ़्लैशकार्ड मेकर
  • क्विज़ मेकर
  • माइंड मैप मेकर

प्रोडक्ट

  • कीमतें
  • Chrome एक्सटेंशन
  • मुफ़्त एक्सटेंशन
  • स्टडी सेट देखें
  • ब्लॉग

सहायता

  • सहायता केंद्र
  • संपर्क करें
  • गोपनीयता नीति
  • सेवा की शर्तें

तुलना करें

  • Chegg का विकल्प
  • Course Hero का विकल्प
  • Coursology का विकल्प
  • Photomath का विकल्प
  • Gauthmath का विकल्प
  • PhotoSolve का विकल्प
  • CollegeTools का विकल्प
  • Transcript का विकल्प
  • SmartSolve का विकल्प
  • Homeworkify का विकल्प
  • AnswersAi का विकल्प
  • StudyX का विकल्प
  • Quizlet का विकल्प
  • Anki का विकल्प
  • Knowt का विकल्प
  • Brainscape का विकल्प
  • सभी तुलनाएँ

© 2026 StudyFox AI. सर्वाधिकार सुरक्षित।

  • X
  • Discord
  • Instagram
ExploreMathStatisticsReading Graphs and Charts

Quiz · Easy

Reading Graphs and Charts

Practice the data questions from SAT, ACT and intro statistics: bar charts, box plots, pie charts and scatter plots.

by Kill h.11 questionsCreated Nov 8, 2026, 08:04 PM
Statistics· Descriptive StatisticsTags#statistics#data#sat

11 questions

  1. 1

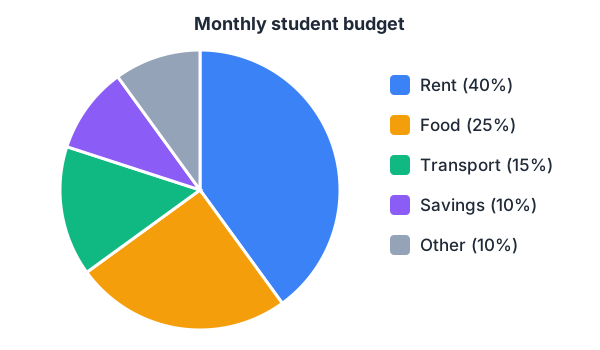
    A student's income is $2,000 a month. How much goes to food?
    • A

      $250

    • B

      $400

    • $500

    • D

      $800

    25% of $2,000 = $500.

  2. 2

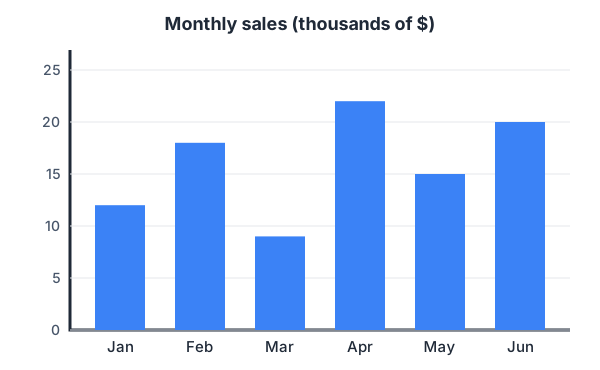
    In which month were sales highest?

    • A

      February

    • April

    • C

      June

    • D

      May

    April's bar is the tallest, at $22k.

  3. 3

    How much higher were April's sales than March's?

    • A

      $9k

    • B

      $11k

    • $13k

    • D

      $22k

    22 − 9 = 13, so $13k.

  4. 4

    What was the mean monthly sales figure from January to June?

    • A

      $15k

    • $16k

    • C

      $17k

    • D

      $18k

    (12 + 18 + 9 + 22 + 15 + 20) / 6 = 96 / 6 = 16, so $16k.

  5. 5

    In how many months were sales above $15k?

    • A

      2

    • 3

    • C

      4

    • D

      5

    February (18), April (22) and June (20). May is exactly 15, which is not above 15.

  6. 6

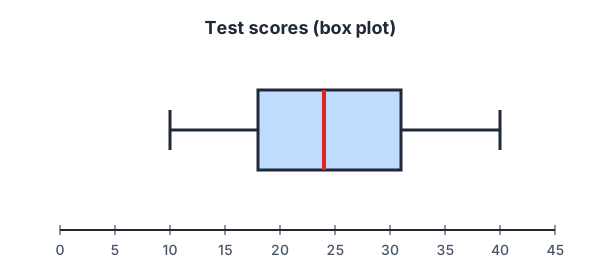
    What is the median test score?

    • A

      18

    • 24

    • C

      25

    • D

      31

    The line inside the box marks the median: 24.

  7. 7

    What is the interquartile range (IQR)?

    • 13

    • B

      30

    • C

      7

    • D

      24

    IQR = Q3 − Q1 = 31 − 18 = 13. 30 is the range (40 − 10).

  8. 8

    About what percentage of students scored above 31?

    • A

      50%

    • B

      75%

    • 25%

    • D

      10%

    31 is Q3; a quarter of the data lies above the third quartile.

  9. 9

    What fraction of the budget is rent?

    • A

    • C

    • D

    40% = 40/100 = 2/5.

  10. 10

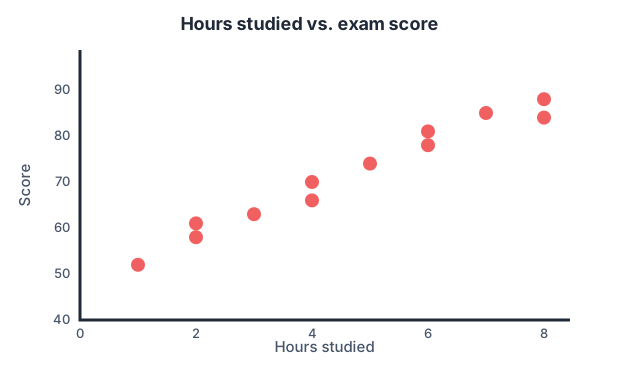
    Which statement best describes the relationship shown?
    • A

      Strong negative correlation

    • B

      No correlation

    • Strong positive correlation

    • D

      Studying causes higher scores

    Points rise from left to right in a tight band: a strong positive correlation. Correlation alone cannot prove causation.

  11. 11

    Using the trend, which score is most likely for a student who studied 5 hours?

    • A

      55

    • B

      62

    • 74

    • D

      90

    The point at 5 hours sits at 74, right on the trend.