StudyFox
कीमतेंब्लॉगएक्सटेंशनमुफ़्त टूल
  • कीमतें
  • ब्लॉग
  • एक्सटेंशन
  • मुफ़्त टूल
  • शुरू करेंसाइन इन
StudyFox

अपने नोट्स, PDF और स्लाइड्स को फ़्लैशकार्ड, क्विज़, नोट्स और माइंड मैप में बदलें।

StudyFox खोलें

स्टडी टूल्स

  • होमवर्क हेल्पर
  • नोट मेकर
  • फ़्लैशकार्ड मेकर
  • क्विज़ मेकर
  • माइंड मैप मेकर

प्रोडक्ट

  • कीमतें
  • Chrome एक्सटेंशन
  • मुफ़्त एक्सटेंशन
  • स्टडी सेट देखें
  • ब्लॉग

सहायता

  • सहायता केंद्र
  • संपर्क करें
  • गोपनीयता नीति
  • सेवा की शर्तें

तुलना करें

  • Chegg का विकल्प
  • Course Hero का विकल्प
  • Coursology का विकल्प
  • Photomath का विकल्प
  • Gauthmath का विकल्प
  • PhotoSolve का विकल्प
  • CollegeTools का विकल्प
  • Transcript का विकल्प
  • SmartSolve का विकल्प
  • Homeworkify का विकल्प
  • AnswersAi का विकल्प
  • StudyX का विकल्प
  • Quizlet का विकल्प
  • Anki का विकल्प
  • Knowt का विकल्प
  • Brainscape का विकल्प
  • सभी तुलनाएँ

© 2026 StudyFox AI. सर्वाधिकार सुरक्षित।

  • X
  • Discord
  • Instagram
ExploreSocial StudiesSociologyInequality in Data and History: Class, Race, Gender and Global

Flashcards

Inequality in Data and History: Class, Race, Gender and Global

Charts, maps, photographs and landmark studies of inequality: Booth and Du Bois, Jim Crow, the Gini and Lorenz diagram, the wage gap, audit studies, caste and global stratification.

by Kill h.38 cards
Sociology· InequalityTags#sociology#inequality#case-studies#class
Front

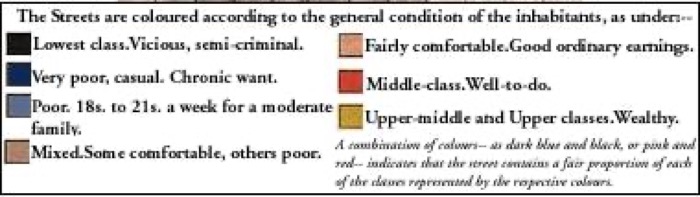
What did Charles Booth's poverty maps of London (1889-1903) color-code, and what is the lowest category?

Tap to flip

Back

Streets, colored by the general condition of the inhabitants. Black = lowest class, vicious, semi-criminal; dark blue = very poor, casual, chronic want; light blue = poor; purple = mixed; pink = fairly comfortable; red = middle class; yellow = upper-middle and upper classes, wealthy.

Tap to see the front

1 / 38

38 cards