StudyFox
कीमतेंब्लॉगएक्सटेंशनमुफ़्त टूल
  • कीमतें
  • ब्लॉग
  • एक्सटेंशन
  • मुफ़्त टूल
  • शुरू करेंसाइन इन
StudyFox

अपने नोट्स, PDF और स्लाइड्स को फ़्लैशकार्ड, क्विज़, नोट्स और माइंड मैप में बदलें।

StudyFox खोलें

स्टडी टूल्स

  • होमवर्क हेल्पर
  • नोट मेकर
  • फ़्लैशकार्ड मेकर
  • क्विज़ मेकर
  • माइंड मैप मेकर

प्रोडक्ट

  • कीमतें
  • Chrome एक्सटेंशन
  • मुफ़्त एक्सटेंशन
  • स्टडी सेट देखें
  • ब्लॉग

सहायता

  • सहायता केंद्र
  • संपर्क करें
  • गोपनीयता नीति
  • सेवा की शर्तें

तुलना करें

  • Chegg का विकल्प
  • Course Hero का विकल्प
  • Coursology का विकल्प
  • Photomath का विकल्प
  • Gauthmath का विकल्प
  • PhotoSolve का विकल्प
  • CollegeTools का विकल्प
  • Transcript का विकल्प
  • SmartSolve का विकल्प
  • Homeworkify का विकल्प
  • AnswersAi का विकल्प
  • StudyX का विकल्प
  • Quizlet का विकल्प
  • Anki का विकल्प
  • Knowt का विकल्प
  • Brainscape का विकल्प
  • सभी तुलनाएँ

© 2026 StudyFox AI. सर्वाधिकार सुरक्षित।

  • X
  • Discord
  • Instagram
ExploreEngineering & TechData Science & AIData Analysis Diagrams: Box Plots, Distributions, Correlation & Test Accuracy

Flashcards

Data Analysis Diagrams: Box Plots, Distributions, Correlation & Test Accuracy

Read and label the key analysis figures: box plot anatomy, the 68-95-99.7 rule, skewed histograms, Anscombe's quartet, correlation patterns, the central limit theorem, Simpson's paradox and sensitivity vs specificity.

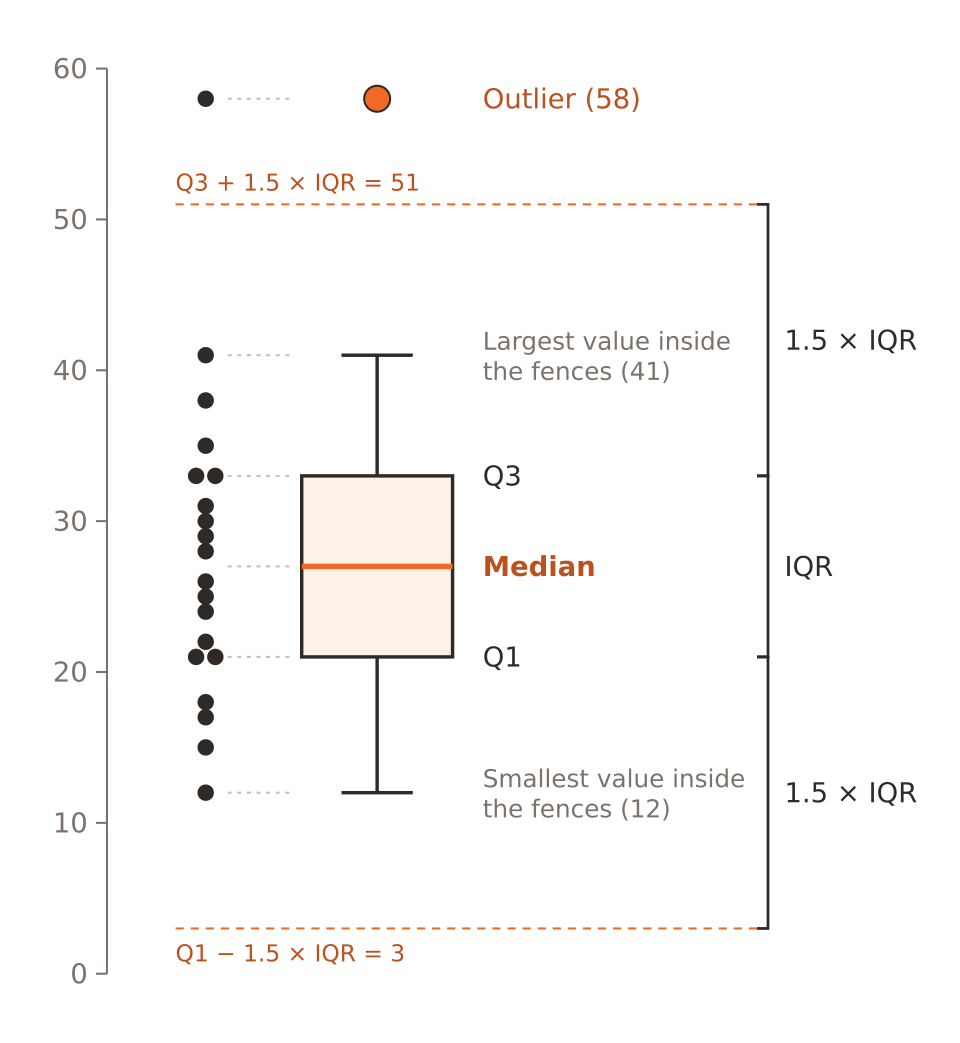
by Kill h.38 cards
Data Science & AI· Data AnalysisTags#data-analysis#charts#statistics#diagrams
Front

Name the hidden label for the line inside the box.

Tap to flip

Back

Name the hidden label for the line inside the box.

Median

Tap to see the front

1 / 38

38 cards