StudyFox
कीमतेंब्लॉगएक्सटेंशनमुफ़्त टूल
  • कीमतें
  • ब्लॉग
  • एक्सटेंशन
  • मुफ़्त टूल
  • शुरू करेंसाइन इन
StudyFox

अपने नोट्स, PDF और स्लाइड्स को फ़्लैशकार्ड, क्विज़, नोट्स और माइंड मैप में बदलें।

StudyFox खोलें

स्टडी टूल्स

  • होमवर्क हेल्पर
  • नोट मेकर
  • फ़्लैशकार्ड मेकर
  • क्विज़ मेकर
  • माइंड मैप मेकर

प्रोडक्ट

  • कीमतें
  • Chrome एक्सटेंशन
  • मुफ़्त एक्सटेंशन
  • स्टडी सेट देखें
  • ब्लॉग

सहायता

  • सहायता केंद्र
  • संपर्क करें
  • गोपनीयता नीति
  • सेवा की शर्तें

तुलना करें

  • Chegg का विकल्प
  • Course Hero का विकल्प
  • Coursology का विकल्प
  • Photomath का विकल्प
  • Gauthmath का विकल्प
  • PhotoSolve का विकल्प
  • CollegeTools का विकल्प
  • Transcript का विकल्प
  • SmartSolve का विकल्प
  • Homeworkify का विकल्प
  • AnswersAi का विकल्प
  • StudyX का विकल्प
  • Quizlet का विकल्प
  • Anki का विकल्प
  • Knowt का विकल्प
  • Brainscape का विकल्प
  • सभी तुलनाएँ

© 2026 StudyFox AI. सर्वाधिकार सुरक्षित।

  • X
  • Discord
  • Instagram
ExploreEngineering & TechData Science & AIMachine Learning Diagrams: Confusion Matrix, ROC, Bias-Variance & Cross-Validation

Flashcards

Machine Learning Diagrams: Confusion Matrix, ROC, Bias-Variance & Cross-Validation

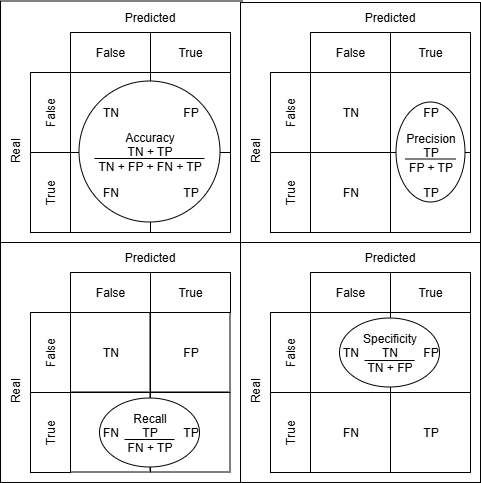
Label and interpret the key evaluation figures: confusion-matrix metrics, ROC curve, precision vs recall, bias-variance curve, k-fold cross-validation and over/underfitting.

by Kill h.30 cards
Data Science & AI· Machine LearningTags#machine-learning#evaluation#diagrams#roc
Front

Which metric does the oval in the BOTTOM-LEFT panel of this figure describe, and what question does it answer?

Tap to flip

Back

Recall (sensitivity, true positive rate) = TP / (TP + FN). Of all the REAL positives, how many did the model find?

Tap to see the front

1 / 30

30 cards