Inequality in Data and History: Class, Race, Gender and Global
Charts, maps, photographs and landmark studies of inequality: Booth and Du Bois, Jim Crow, the Gini and Lorenz diagram, the wage gap, audit studies, caste and global stratification.
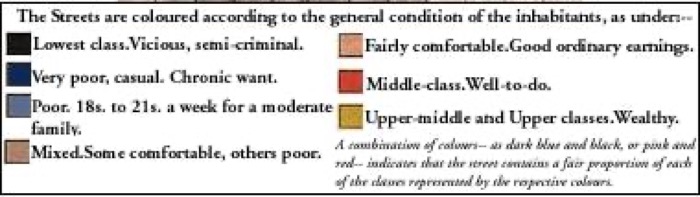
What did Charles Booth's poverty maps of London (1889-1903) color-code, and what is the lowest category?
Tap to flip
Back
Streets, colored by the general condition of the inhabitants. Black = lowest class, vicious, semi-criminal; dark blue = very poor, casual, chronic want; light blue = poor; purple = mixed; pink = fairly comfortable; red = middle class; yellow = upper-middle and upper classes, wealthy.