Quiz · Medium
Nineteen questions with cost-behavior graphs and CVP charts: fixed, variable, mixed and step costs, break-even, target profit, margin of safety and operating leverage.
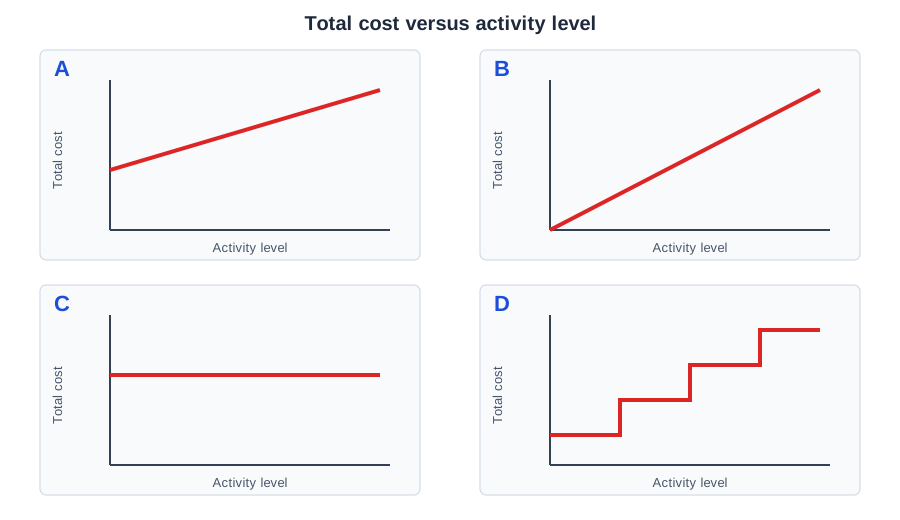
Which graph shows a variable cost?
Graph A
Graph B
Graph C
Graph D
A variable cost starts at zero and rises in proportion to activity. A is mixed (starts above zero), C is fixed (flat) and D is a step cost.
A phone plan costs $30 per month plus $0.10 per minute. Which graph shows the total monthly cost?
Graph B
Graph A
Graph C
Graph D
A fixed fee plus a per-minute charge is a mixed cost: a positive intercept with an upward slope.
Which item is most likely to follow graph C within the relevant range?
Straight-line depreciation on the factory building
Direct materials
Sales commissions
Electricity charged per kilowatt-hour
Graph C is a fixed cost, which does not change with activity. The other items rise with volume.
Graph D is typical of which cost?
Direct materials
Rent on a leased plant
One supervisor hired for every 20 additional workers
A fixed salary for the CEO
A step cost is constant over a range and jumps when capacity is exceeded. Rent and a CEO salary are fixed; direct materials are variable.
Within the relevant range, what happens to fixed cost per unit as production rises?
It rises
It stays constant
It falls
It becomes variable
Total fixed cost is spread over more units. Variable cost per unit is the one that stays constant.
Price $50, variable cost $30, fixed costs $40,000. What is break-even in units?
800
1,333
2,000
4,000
CM = $20, so 40,000 / 20 = 2,000 units. 800 divides by price, 1,333 by variable cost and 4,000 by an incorrect CM of $10.
Using the same data, how many units must be sold to earn a $10,000 profit?
2,000
2,500
2,200
3,000
(40,000 + 10,000) / 20 = 2,500. Break-even units cover fixed costs only; the target profit must be added to the numerator.
The CM ratio is 40% and fixed costs are $80,000. What are break-even sales?
$32,000
$120,000
$200,000
$320,000
80,000 / 0.40 = $200,000. Multiplying 80,000 by 0.40 gives $32,000, a common slip.
Expected sales are $300,000 and break-even sales are $200,000. What is the margin of safety ratio?
50%
33%
67%
100%
Margin of safety = 100,000, which is 100,000 / 300,000 = 33% of sales. 50% divides by break-even sales instead.
The degree of operating leverage is 3.0. If sales rise 10%, operating income rises about...
3%
30%
10%
13%
A DOL of 3 multiplies the percentage change in sales. Fixed costs do not change, so extra contribution drops straight to profit.
Fixed costs rise by $10,000 and CM is $20 per unit. What happens to break-even units?
They rise by 500
They rise by 200
They rise by 10,000
They are unchanged
Extra fixed costs must be covered by extra units of contribution: 10,000 / 20 = 500.
Price falls to $45 while variable cost stays $30 and fixed costs are $40,000. What is the new break-even?
2,000 units
About 2,667 units
2,500 units
3,200 units
CM drops to $15, so 40,000 / 15 = 2,667. A price cut raises break-even more than students expect.
X and Y are sold in a 3:1 mix. CM is $10 for X and $20 for Y; fixed costs are $100,000. How many units of X must be sold to break even?
5,000
4,000
2,000
6,000
A package of 3X + 1Y gives $50 of CM, so 2,000 packages are needed, which is 6,000 X and 2,000 Y.
After-tax target income is $45,000, tax rate 25%, CM $30 per unit and fixed costs $90,000. Units required?
5,000
4,500
3,000
6,000
Pretax profit = 45,000 / 0.75 = 60,000. Units = (90,000 + 60,000) / 30 = 5,000. Using $45,000 directly gives 4,500.
Which is NOT an assumption of basic CVP analysis?
Costs can be separated into fixed and variable
Sales mix is constant
Selling price per unit falls as volume rises
Revenues and costs are linear in the relevant range
Basic CVP assumes a constant price. Quantity discounts would make revenue non-linear and violate the model.
Under absorption costing, fixed manufacturing overhead is a product cost.
True
False
Absorption costing assigns all manufacturing costs, including fixed overhead, to units. Variable costing expenses fixed overhead in the period.
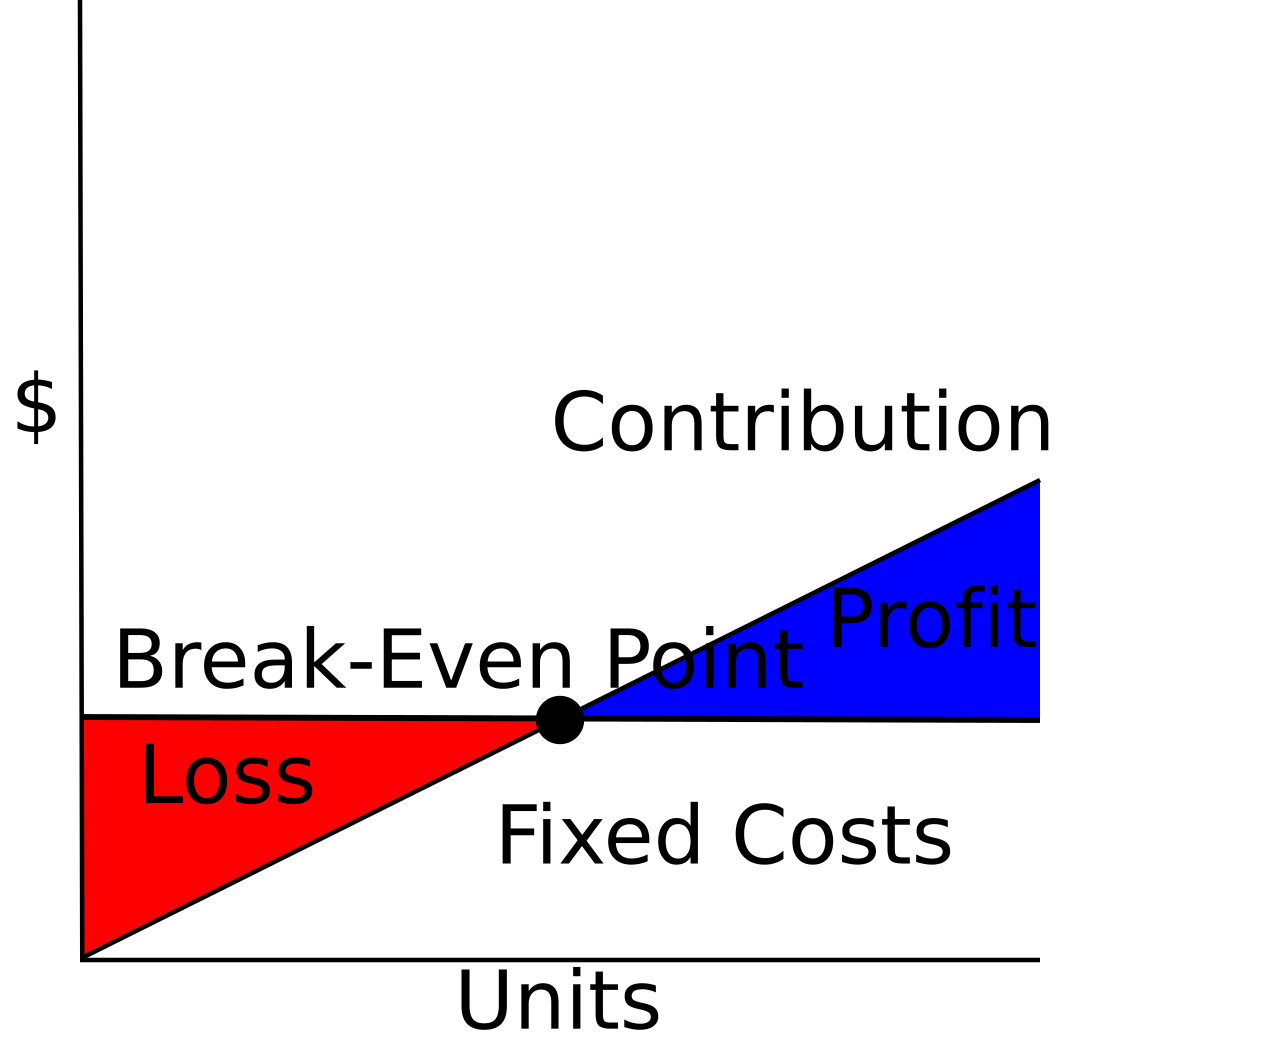
In this contribution-margin chart, how does the break-even point move if fixed costs increase?
To the left: fewer units are needed
It does not move
It moves up but stays at the same volume
To the right: more units are needed
A higher fixed-cost line must be covered by the contribution margin line, which has the same slope, so it crosses later.
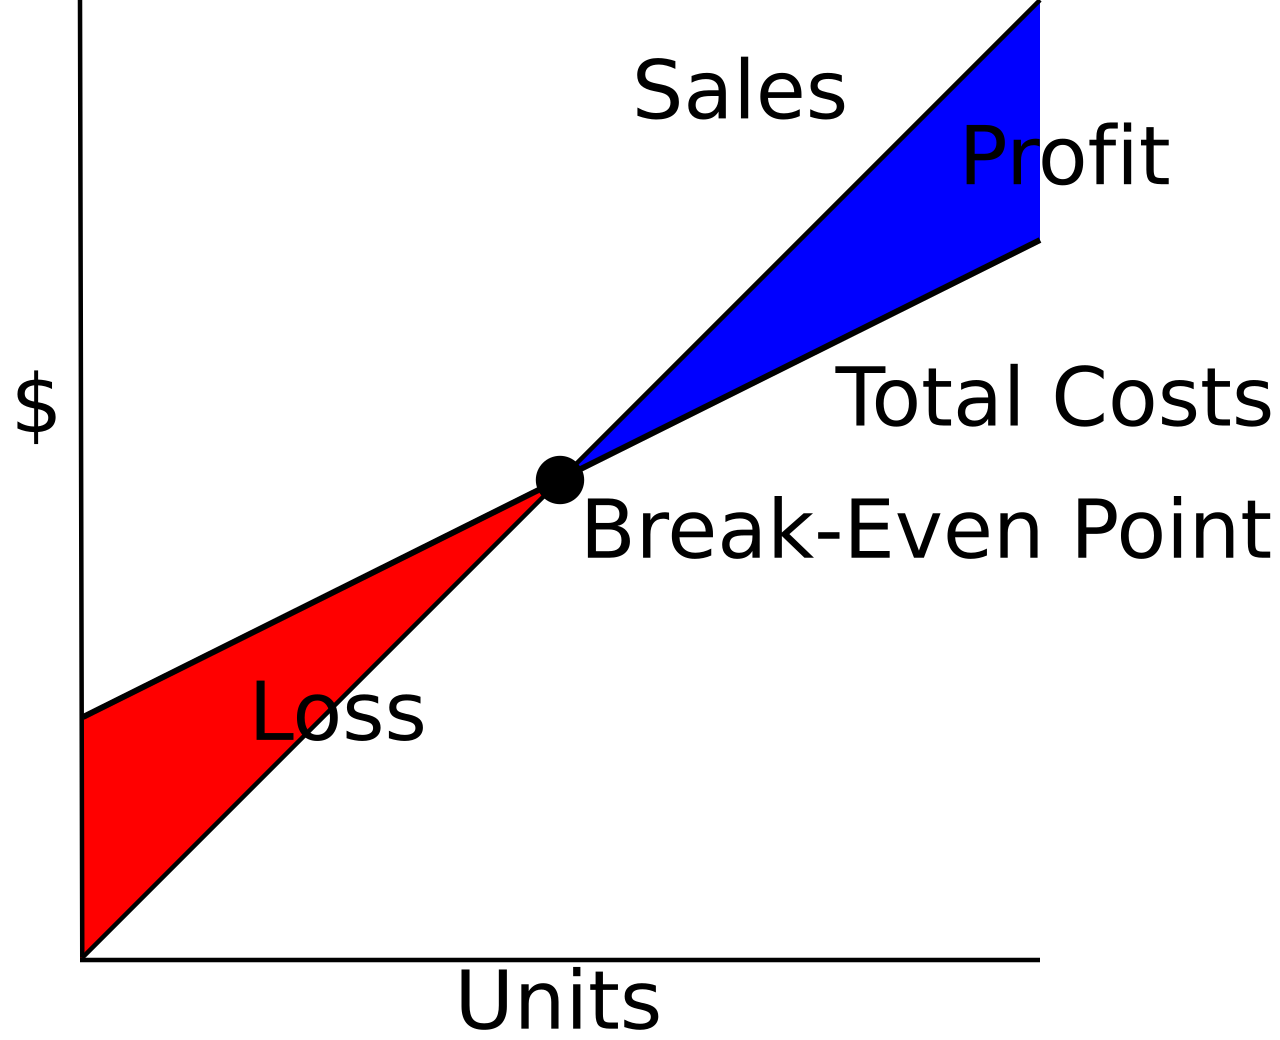
In this chart, what happens to the break-even point if the selling price per unit rises (costs unchanged)?
It moves to the right
It does not move
It moves to the left: fewer units are needed
It disappears
A steeper sales line crosses the total cost line sooner. Break-even units = fixed costs / CM per unit, and CM per unit rises with price.
Beyond the break-even point in the contribution-margin chart, each additional unit sold adds to profit by...
Its selling price
Its variable cost per unit
Its fixed cost per unit
Its unit contribution margin
Fixed costs are already covered, so every extra unit adds price minus variable cost to profit.
