Quiz · Medium
Descriptive statistics, z-scores, correlation, p-values, errors, power, effect size and the replication crisis.
Which measure of central tendency is most affected by an extreme outlier?
The median
The mean
The mode
The range
The mean uses every score.
In a positively skewed distribution, which order is correct?
Mean > median > mode
Mean < median < mode
Mean = median = mode
Median > mean > mode
The mean is pulled toward the long right tail.
A test has a mean of 100 and an SD of 15. A score of 130 has a z-score of:
+1
+3
+30
+2
z = (130 - 100) / 15 = 2.
About what percentage of scores in a normal distribution lie within 2 SDs of the mean?
68
99.7
95
50
The empirical rule: 68-95-99.7.
Which statistic is the most appropriate average for ordinal data?
Mean
Median
Standard deviation
Variance
Ranks have unequal gaps, so the median is safer.
A correlation of r = -.80 indicates:
a strong negative relationship
a weak negative relationship
a strong positive relationship
no relationship
The sign gives the direction; the size gives the strength.
If r = .60, what proportion of variance is shared between the two variables?
60 percent
6 percent
84 percent
36 percent
r squared = .36.
Ice cream sales and drowning deaths are positively correlated. The best explanation is:
ice cream causes drowning
drowning causes ice cream sales
a third variable (hot weather)
the correlation is negative
Correlation does not show causation.
Anscombe's quartet shows that:
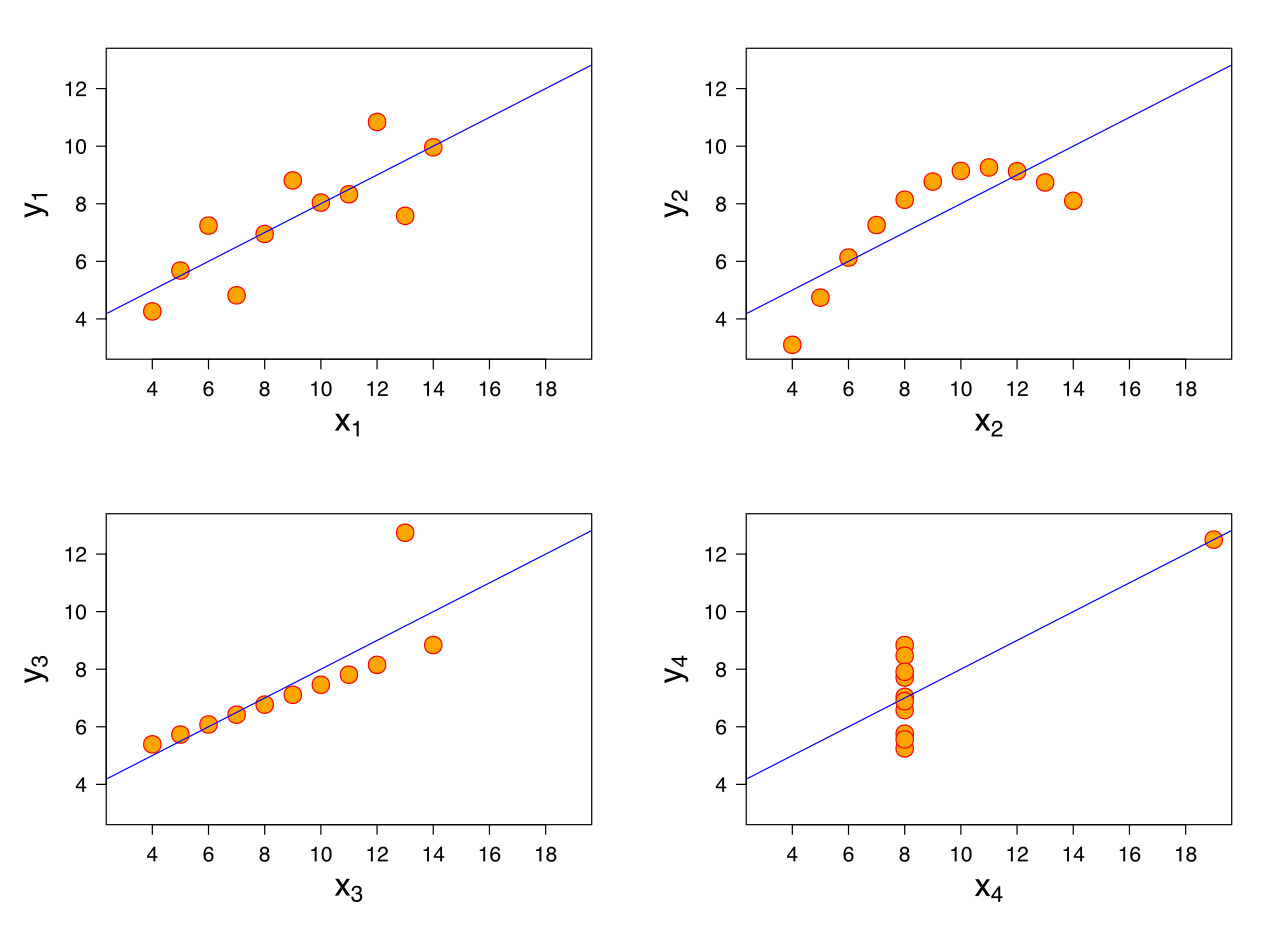
all correlations are meaningless
datasets with identical summary statistics can look very different
means are always misleading
outliers can be ignored
Always graph your data.
A p-value of .03 means:
the probability of data this extreme, if H0 were true, is 3 percent
there is a 3 percent chance H0 is true
there is a 97 percent chance the hypothesis is true
the effect size is small
It is conditional on the null hypothesis.
Rejecting a null hypothesis that is actually true is a:
Type II error
Type III error
power error
Type I error
Its probability is alpha.
Which change would increase statistical power?
Lowering alpha to .001
Using a smaller expected effect
Increasing the sample size
Adding more variability
More data reduce standard error.
Cohen's d of 0.8 would conventionally be described as:
small
large
medium
negligible
Benchmarks are .2 small, .5 medium, .8 large.
Which test is most appropriate to compare the means of three or more independent groups?
ANOVA
Paired t-test
Chi-square test
Pearson correlation
Multiple t-tests would inflate the Type I error rate.
The Open Science Collaboration (2015) found that:
all studies replicated
none replicated
97 percent replicated
about 36 percent of replications of published psychology studies were significant
Effect sizes were about half the original size.
Hypothesizing after the results are known is called:
p-hacking
blinding
HARKing
triangulation
It presents a post hoc finding as if predicted.
