Quiz · Medium
Exam-style problems on standard deviation, quartiles and outliers, Chebyshev, the effect of transformations and choosing the right summary.
For 2, 4, 4, 4, 5, 5, 7, 9, what is the population standard deviation?
4
2
2.14
5
Mean 5; squared deviations sum to 32; variance = 32/8 = 4; sigma = 2. Using 7 in the denominator gives the sample value 2.14.
For the same data (2, 4, 4, 4, 5, 5, 7, 9), the sample standard deviation is approximately...
2.14
2.00
4.57
1.89
s^2 = 32/7 ≈ 4.571, so s ≈ 2.14. 4.57 is the variance.
In the data 4, 7, 9, 10, 12, 14, 15, 18, 21, 40, which statement is correct using the 1.5 x IQR rule with Q1 = 9 and Q3 = 18?
There are no outliers because 40 < 18 + 40
4 is an outlier because it is below 9
40 is an outlier because it exceeds the mean
40 is an outlier because it is above 31.5
Upper fence = 18 + 1.5(9) = 31.5. 40 exceeds it. The lower fence is -4.5, so 4 is fine.
A distribution of exam scores has mean 75 and standard deviation 6. A student scores 90. What is the z-score and its interpretation?
z = 15, extremely high
z = 0.4, slightly above average
z = 2.5, well above average
z = 2.5, 2.5% above the mean
z = (90 - 75)/6 = 2.5, meaning 2.5 standard deviations above the mean.
At least what percent of any data set lies within 2 standard deviations of the mean, according to Chebyshev?
68%
75%
95%
89%
1 - 1/2^2 = 0.75. The 95% figure needs a bell-shaped distribution.
Heights are approximately normal with mean 170 cm and standard deviation 10 cm. About what percent are taller than 190 cm?
2.5%
5%
16%
0.15%
190 is 2 standard deviations above the mean. 95% lie within 2 sd, so 5% lie outside and half of that, 2.5%, lies above.
A data set has mean 40 and standard deviation 8. Each value is multiplied by 3 and then 5 is added. What are the new mean and standard deviation?
125 and 29
45 and 24
120 and 24
125 and 24
Mean: 3(40) + 5 = 125. Standard deviation: only scaling matters, 3(8) = 24.
Which set of data has the larger standard deviation: A = 10, 10, 10, 10 or B = 5, 8, 12, 15?
A, because its mean is larger
They are equal because both have mean 10
B, since its values are spread out while A has none
A, because 10 is repeated
A has every value at its mean, so its standard deviation is 0. B varies.
The mean of 5 scores is 80. A sixth score of 92 is added. What is the new mean?
86
82
80
81
Total = 5(80) + 92 = 492, and 492/6 = 82.
The median of a data set is 20 and the mean is 26. The shape is most likely...
Right-skewed
Left-skewed
Symmetric
Uniform
Mean greater than median suggests a long right tail.
Which measure should you use to compare the relative variability of weights in kilograms and heights in centimeters?
The range
The variance
The median
The coefficient of variation
CV = s/mean is unitless, so it compares variability across different units.
A weighted course grade: exams 60%, homework 40%. A student has 70 on exams and 95 on homework. What is the final grade?
82.5
78
80
85
0.6(70) + 0.4(95) = 42 + 38 = 80. The simple average (82.5) ignores the weights.
Which statistic is resistant to outliers?
Standard deviation
Interquartile range
Range
Mean
The IQR uses only the middle 50% of the data. The others depend on extreme values.
A 90th percentile score on a test means that...
About 90% of test takers scored at or below this score
The student answered 90% correctly
The student beat exactly 10 people
About 90% scored above this score
A percentile is a rank position, not a percent correct.
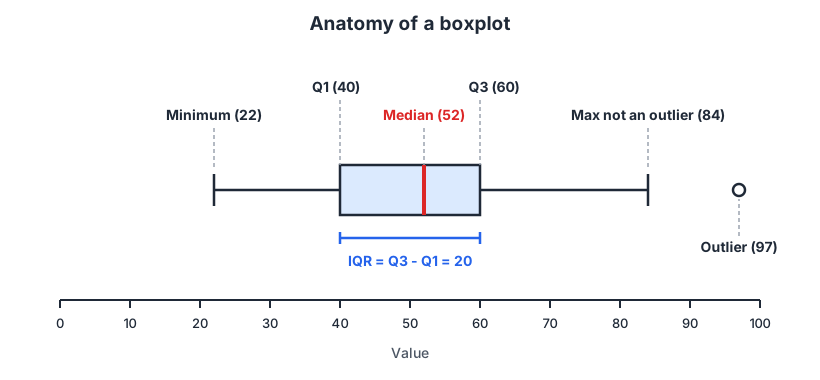
The boxplot below has a whisker ending at 84 and a separate circle at 97. If Q3 = 60 and IQR = 20, why is 97 plotted separately?
Because 97 is above the mean
Because 97 is larger than 3 times the IQR
Because 97 is the maximum
Because 97 is above the upper fence, 60 + 1.5(20) = 90
Values beyond Q3 + 1.5 IQR are flagged and plotted individually as outliers.
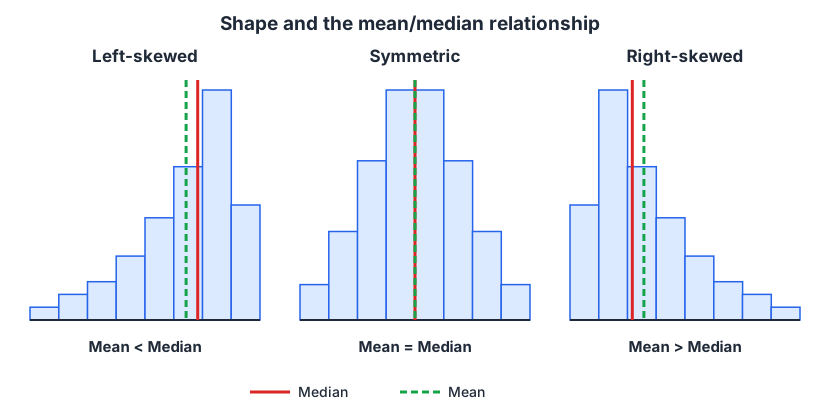
In the three histograms, which pair is correctly matched?
Right-skewed: mean < median
Symmetric: mean > median
Left-skewed: mean < median
Left-skewed: mean > median
In the left-skewed panel, the dashed mean line sits left of the solid median line.
Two classes take the same test. Class A has mean 70, sd 5. Class B has mean 70, sd 12. Which statement is correct?
Class A's scores are more spread out
Class B's scores are more spread out
Class B has a higher median
The classes have identical distributions
A larger standard deviation means more variability around the same mean.
Which graph is most appropriate for the distribution of a single quantitative variable with 500 observations?
A histogram
A pie chart
A bar chart of categories
A two-way table
Histograms display the shape, center and spread of quantitative data.
