Data Analysis Diagrams: Box Plots, Distributions, Correlation & Test Accuracy
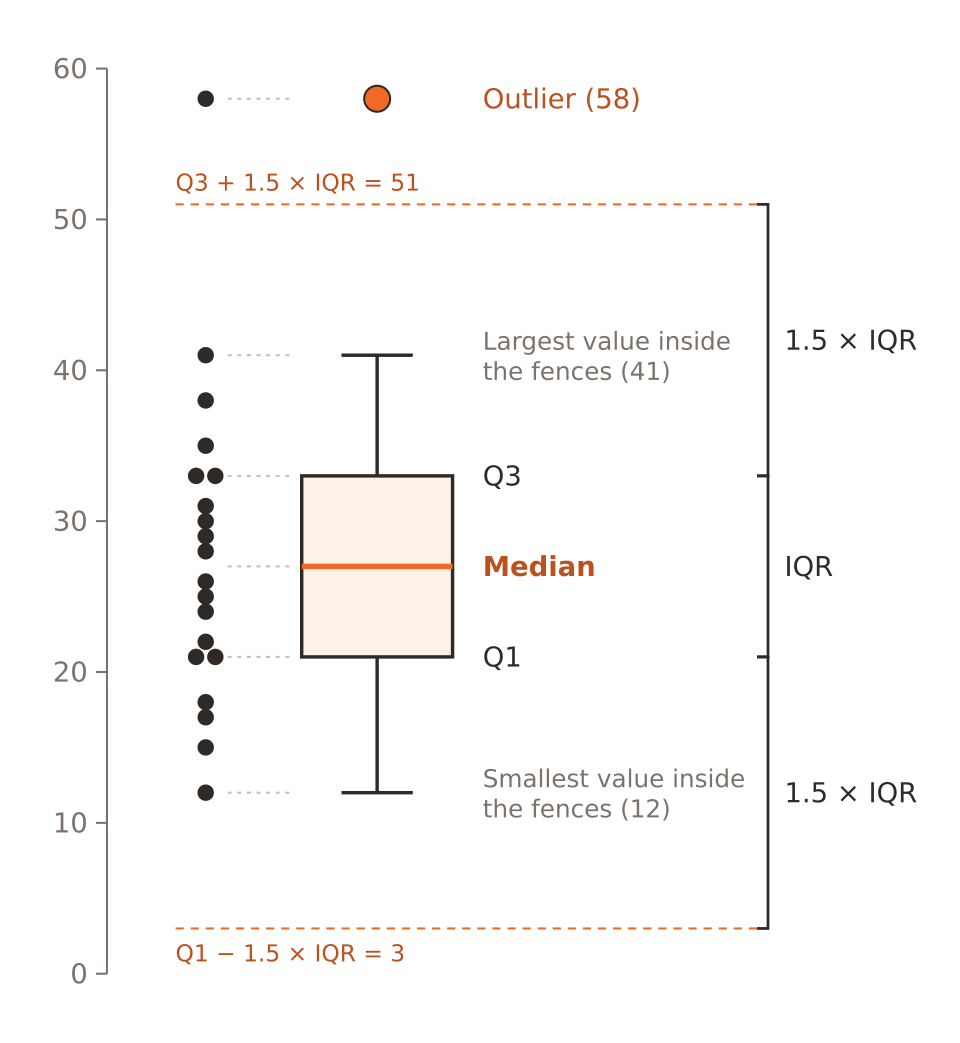
Read and label the key analysis figures: box plot anatomy, the 68-95-99.7 rule, skewed histograms, Anscombe's quartet, correlation patterns, the central limit theorem, Simpson's paradox and sensitivity vs specificity.