Quiz · Medium
Marginal utility, indifference curves, budget lines, the consumer optimum, income and substitution effects, risk and behavioral choice.
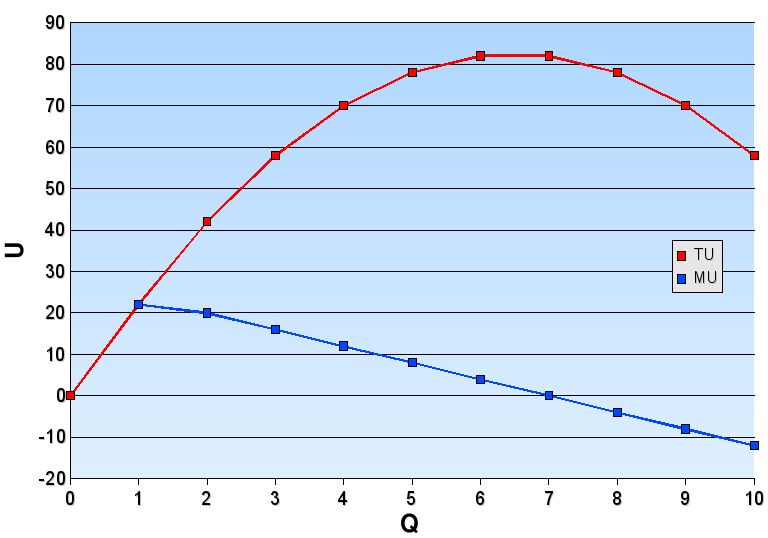
In the figure, marginal utility is zero at which quantity?
5
6
7
9
MU equals the change in TU. TU rises to 82 at Q = 6 and stays at 82 at Q = 7, so MU(7) = 0. Total utility is at its maximum there; after that MU is negative.
Image: Faxe (Wikimedia Commons uploader), CC BY-SA 2.5, via Wikimedia Commons.
A consumer's and . To raise utility without spending more, she should:
Buy more x and less y
Buy more y and less x
Buy more of both
Change nothing; she is at the optimum
A dollar on x yields 6 utils but a dollar on y yields 4, so shifting spending to x raises utility. As she buys more x, falls until the ratios are equal.
, income $120, , . The utility-maximizing quantity of x is:
10
15
20
30
Half of income goes to each good with : $60 on x gives 15 units of x ($60/$4). x = 30 would use all income on x.
, . To keep spending constant, how many units of y must a consumer give up to buy 6 more x?
1
3
6
2
6 more x cost $18. That equals 2 units of y at $9. The slope of the budget line is , so each x costs 1/3 of a y.
Which statement about indifference curves (for standard preferences) is FALSE?
They slope downward
Curves farther from the origin show lower utility
They do not cross
They are convex to the origin
Farther from the origin means more of both goods, so higher utility. Crossing would violate transitivity; downward slope reflects the trade-off; convexity reflects diminishing MRS.
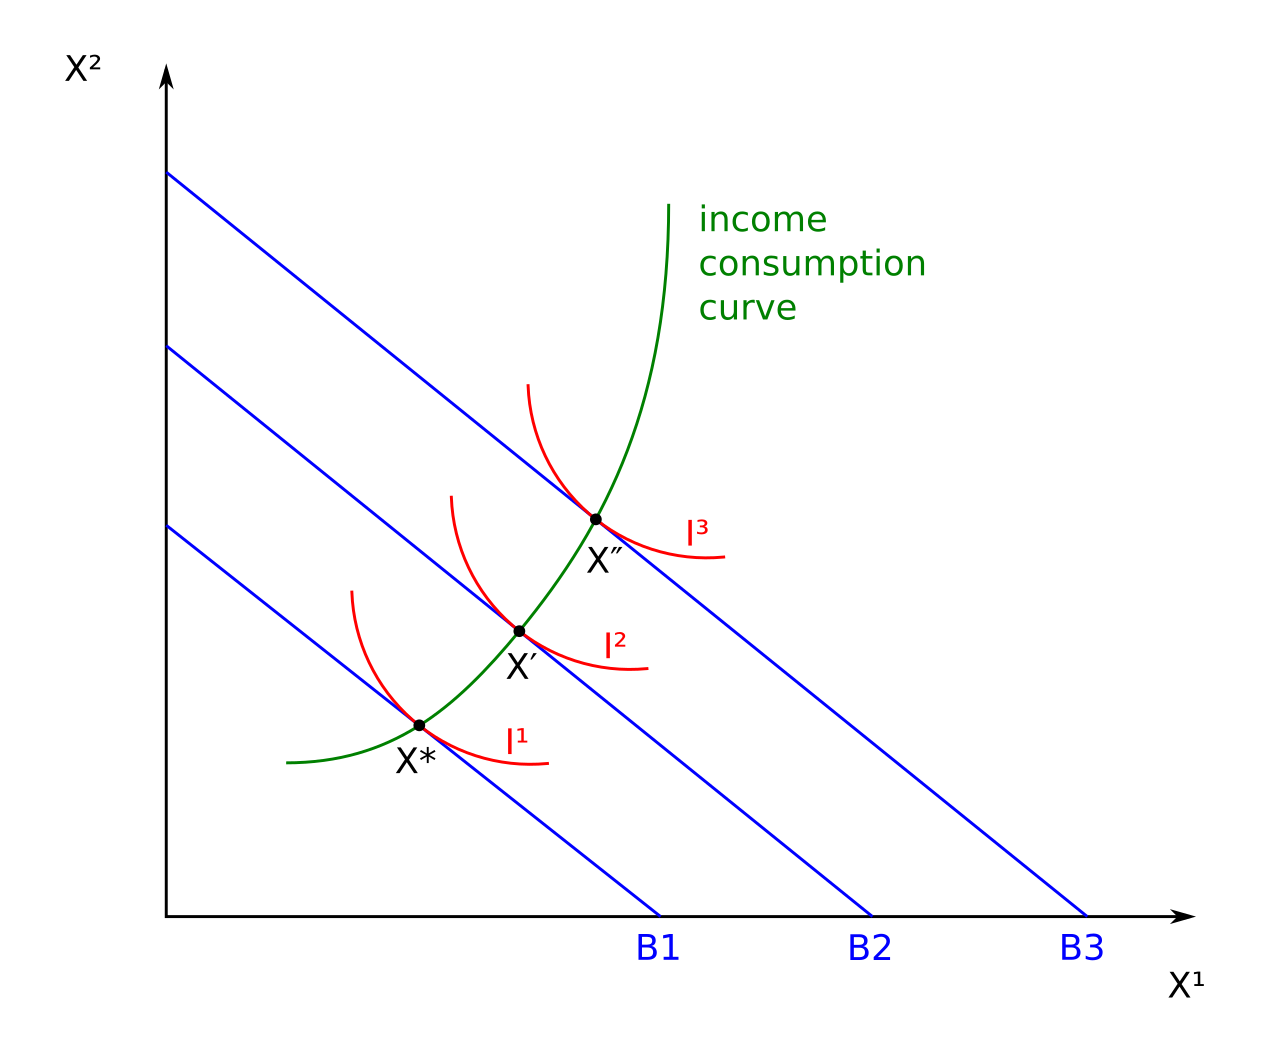
The figure shows income consumption curve for two goods. What does the upward-sloping green curve tell us?
Both goods are inferior
X¹ is inferior and X² is normal
Both goods are normal
The consumer is satiated
As the budget line moves out from B1 to B3, the optimal quantities of both X¹ and X² rise, so both are normal goods.
Image: Vandhana297 (original), WhiteTimberwolf (SVG version), CC BY-SA 3.0, via Wikimedia Commons.
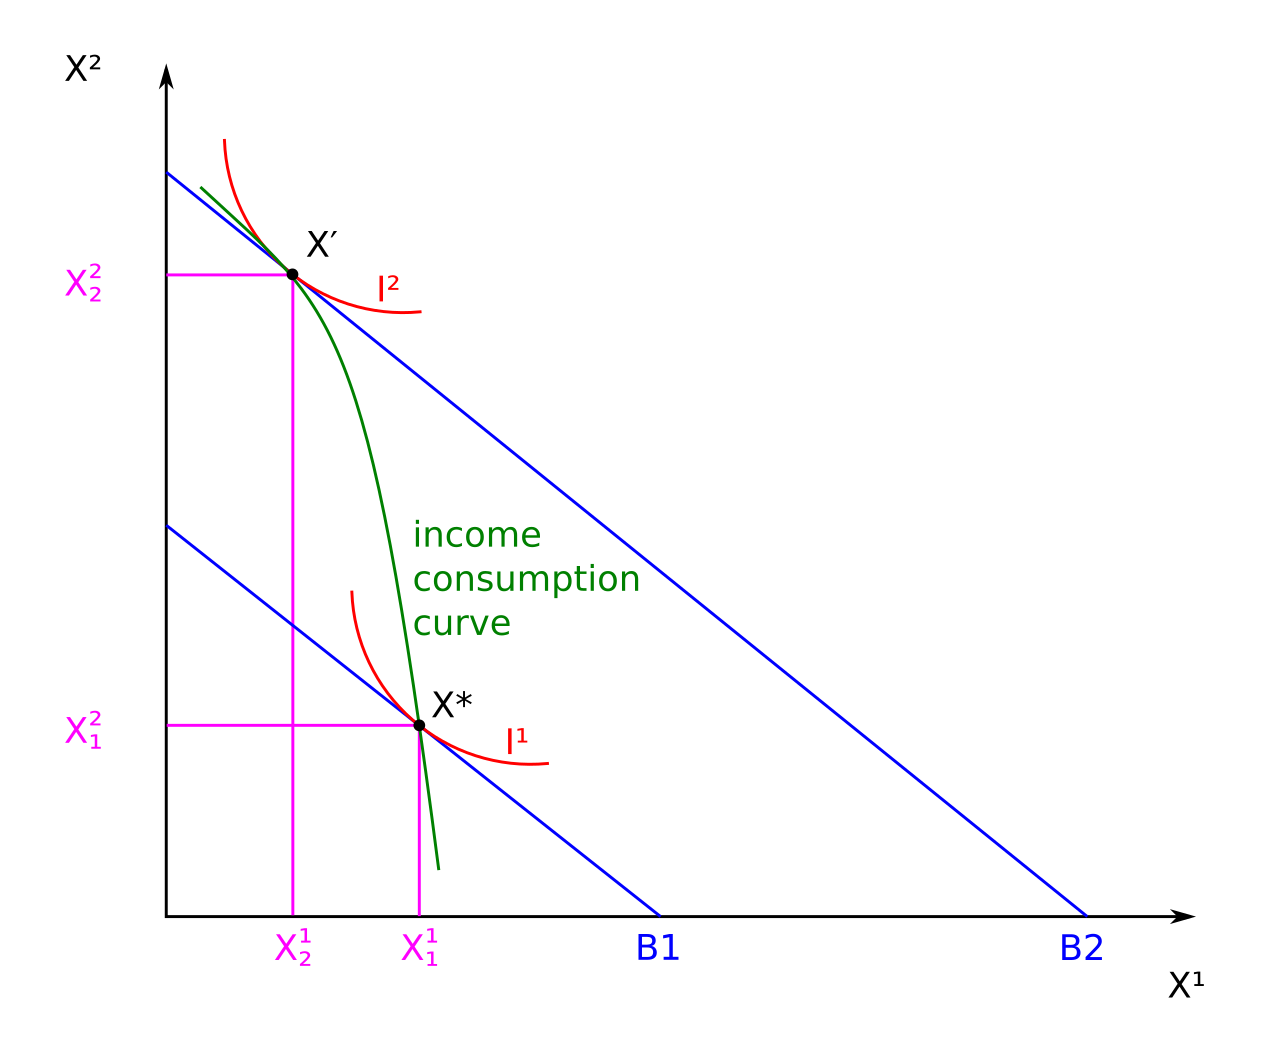
In the figure, as income rises from B1 to B2, which good is inferior?
X¹ (horizontal axis)
X² (vertical axis)
Both
Neither
The optimal quantity of X¹ falls (the bundle moves left) when income rises, so X¹ is inferior. X² rises, so it is normal.
Image: Vandhana297 (original), WhiteTimberwolf (SVG version), CC BY-SA 3.0, via Wikimedia Commons.
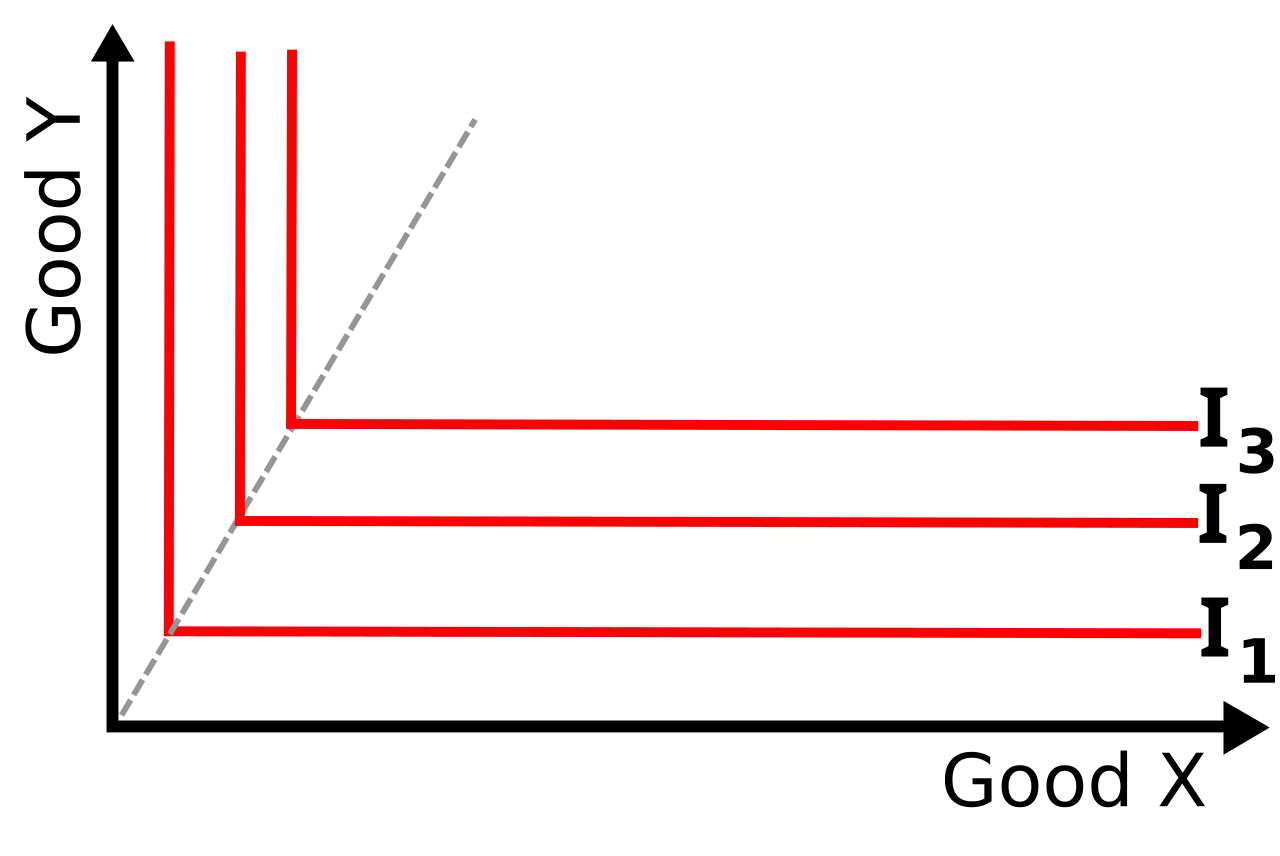
For preferences shown by L-shaped indifference curves, a fall in the price of x causes:
A large substitution effect only
No change in consumption
A switch to spending all income on x
No substitution effect, only an income effect
With perfect complements the consumer wants goods in a fixed proportion, so relative prices do not change the ratio she buys: the substitution effect is zero. She is richer, so she buys more of both (income effect).
Image: SilverStar at English Wikipedia, CC BY 2.5, via Wikimedia Commons.
, , , income $30. The optimal bundle is:
x = 0, y = 15
x = 5, y = 7.5
x = 10, y = 0
x = 6, y = 6
Utility per dollar: x gives 2/3, y gives 1/2. With perfect substitutes the consumer buys only the good with the higher ratio: 10 units of x ($30/$3).
In the figure, what is true at the point (x*, y*)?
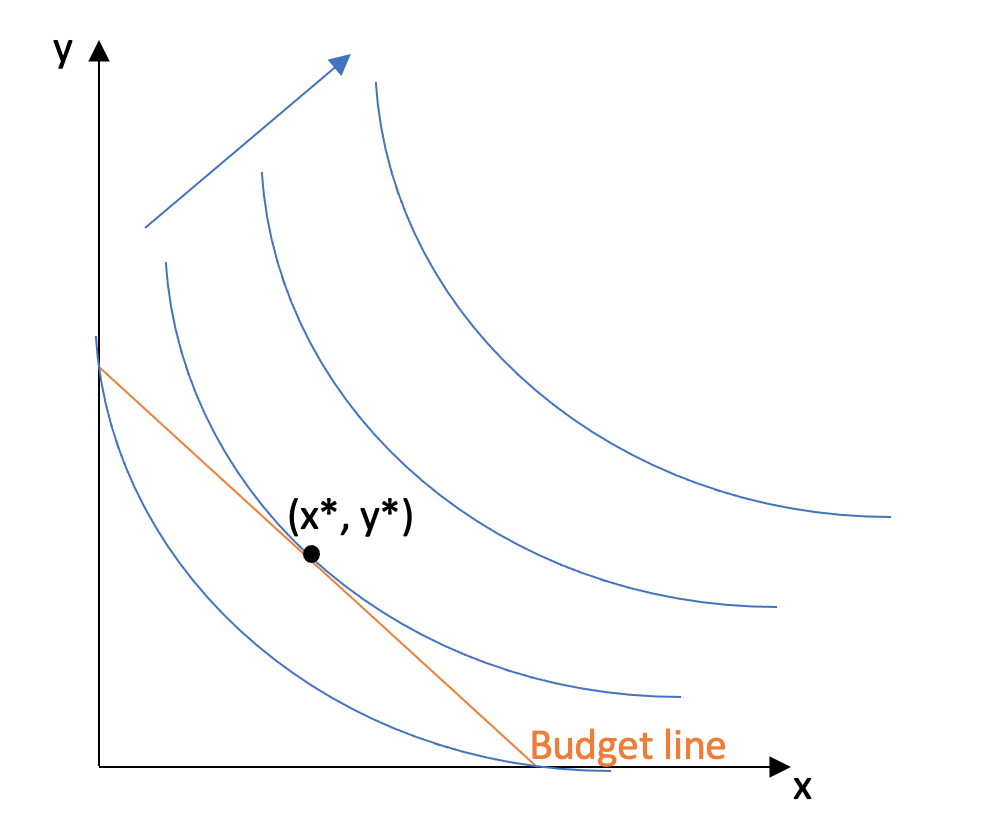
MRS equals the price ratio and the budget is exhausted
MRS is greater than the price ratio
The consumer can reach a higher indifference curve
The consumer spends less than her income
At the tangency the slope of the indifference curve (MRS) equals the slope of the budget line (price ratio). The consumer spends all income and cannot reach a higher curve.
Image: Cromwellecon, CC BY-SA 4.0, via Wikimedia Commons.
A price rise on a normal good causes the quantity demanded to fall. The income effect of the price rise:
Raises quantity, because the consumer feels richer
Lowers quantity, because real income has fallen
Is zero for every good
Has the opposite sign to the substitution effect
A higher price cuts real income. For a normal good this reduces quantity demanded, which reinforces the substitution effect.
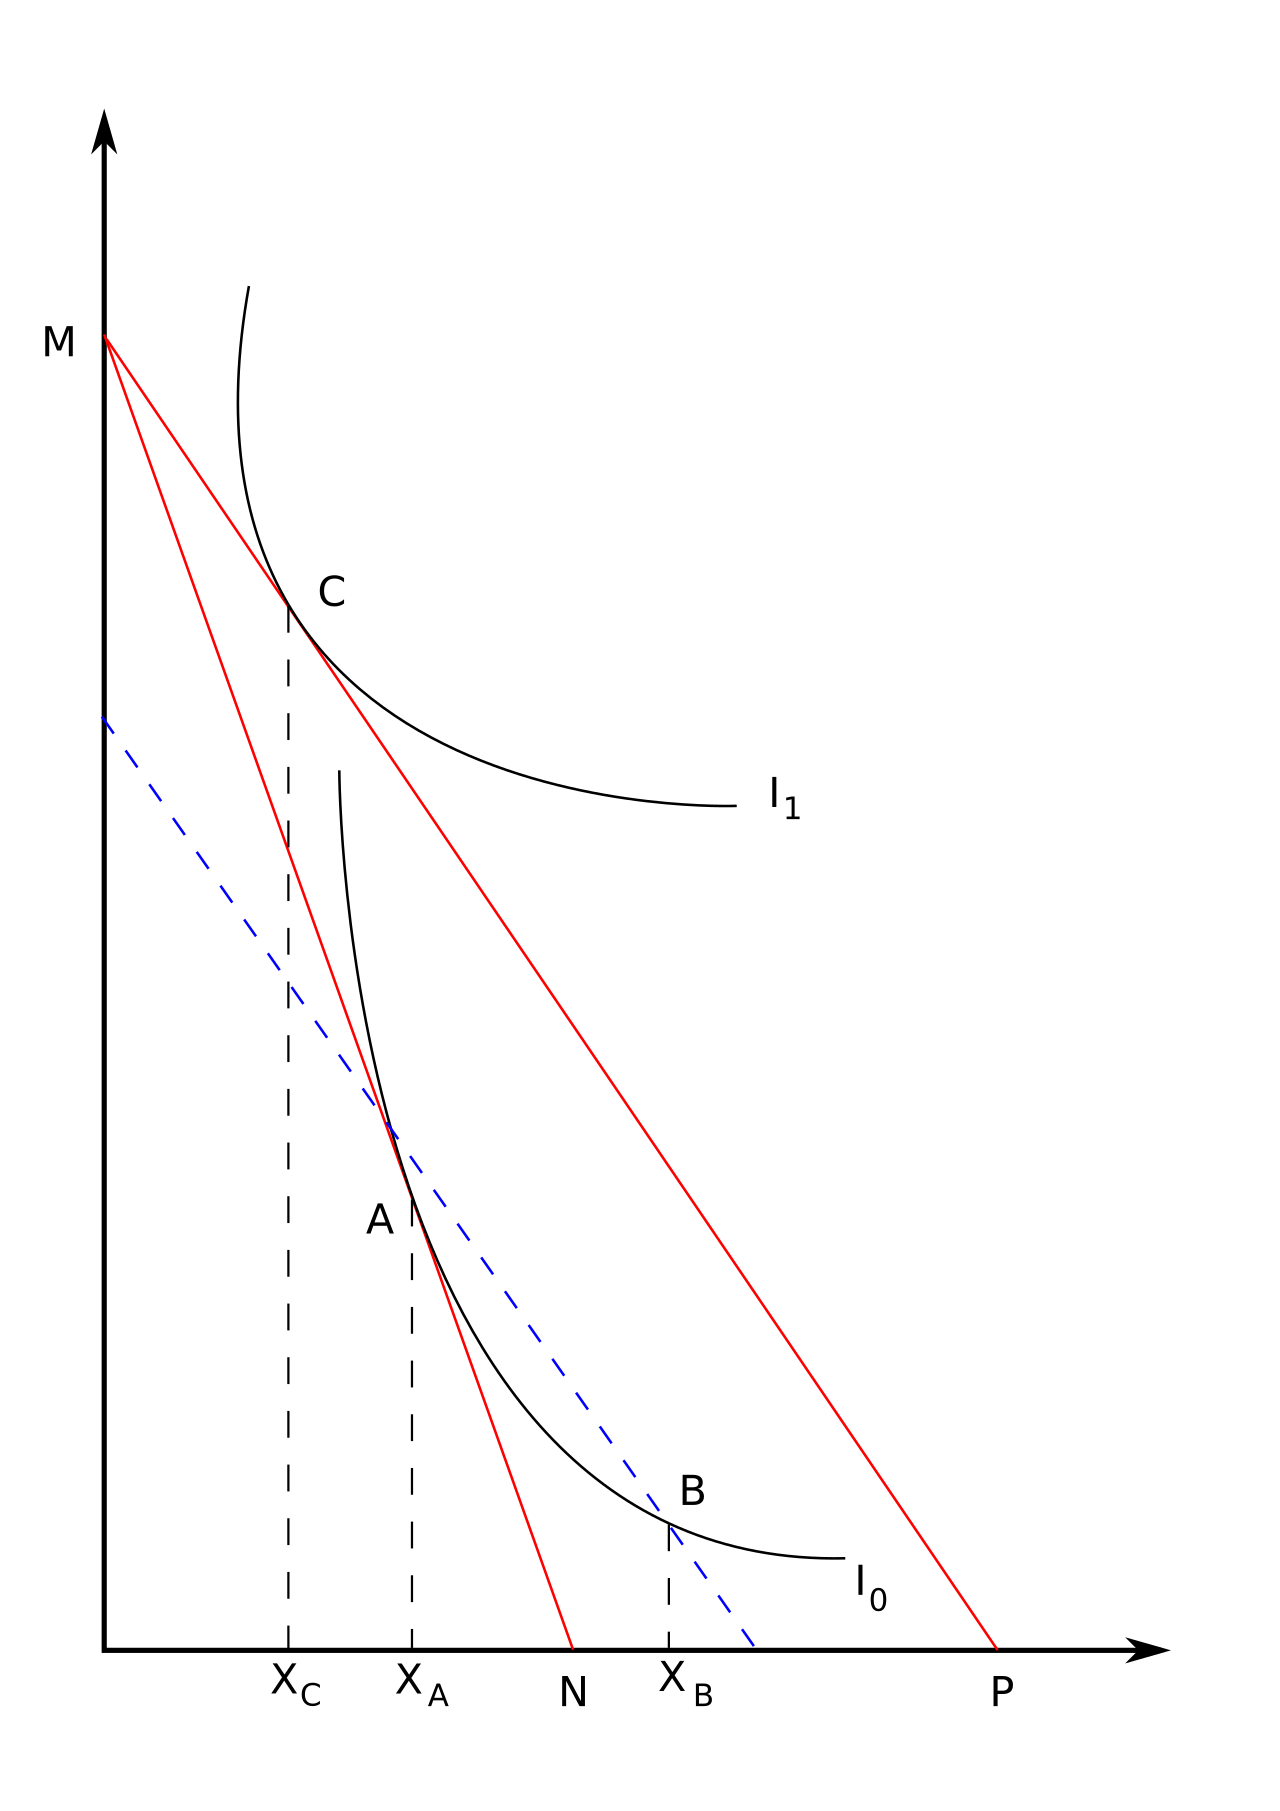
In the figure of a price fall for good X, A is the initial bundle, B the compensated bundle and C the final bundle (X_C < X_A). X is:
A normal good
An inferior good that is not Giffen
A perfect complement
A Giffen good
Quantity of X fell after its price fell (X_C < X_A), which only happens for a Giffen good: the negative income effect (B to C) outweighs the positive substitution effect (A to B).
A worker's wage rises. She chooses to work fewer hours. This is best explained by:
The substitution effect dominating
The income effect dominating
A Giffen good
Diminishing returns
A higher wage makes leisure more expensive (substitution effect: work more) but also makes her richer (income effect: buy more leisure). Working less means the income effect is larger.
Income doubles and every price doubles. The consumer's optimal bundle:
Doubles
Halves
Does not change
Cannot be determined
The budget line is identical to the original, so the feasible set and the optimum are unchanged.
. A person is offered a sure $25 or a 50-50 gamble between $64 and $0. She will:
Take the sure $25, because 5 exceeds the gamble's expected utility of 4
Take the gamble, since the expected value is $32
Be indifferent
Take the gamble because she is risk-loving
Expected utility of the gamble: . The sure $25 gives . Even though the gamble has higher expected value ($32), concave utility means she prefers certainty.
An economist observes a consumer demanding more of a good as its price rises, and attributes it to the product being a status symbol. This is:
A Giffen good
A Hicksian demand
An inferior good
A Veblen good
Veblen goods are demanded partly because they are expensive (conspicuous consumption). Giffen goods are inferior staples; the reason is the income effect, not status.
Which is the best example of the sunk cost fallacy?
Declining to buy a good because its price rose
Saving more after the interest rate rises
Finishing a bad meal because it was expensive
Buying the cheaper of two identical goods
The cost of the meal is already spent whether or not she keeps eating, so it should not influence the decision. Basing it on past, unrecoverable costs is the fallacy.
A person prefers $100 today to $110 tomorrow, yet prefers $110 in 31 days to $100 in 30 days. This pattern is called:
Present bias (hyperbolic discounting)
Risk aversion
Loss aversion
Anchoring
Immediate rewards are overweighted, so preferences reverse as dates approach. Consistent exponential discounting would give the same choice in both cases.
The Slutsky equation splits the total effect of a price change into:
Supply and demand effects
Substitution and income effects
Price and quantity effects
Short-run and long-run effects
Total effect = substitution effect (holding purchasing power or utility fixed) + income effect (change in real income).
. What share of income is spent on y?
25%
50%
It depends on prices
75%
With Cobb-Douglas utility, the expenditure share on each good equals its exponent divided by the sum of exponents: 0.75/(0.25 + 0.75) = 75%. The share does not depend on prices.
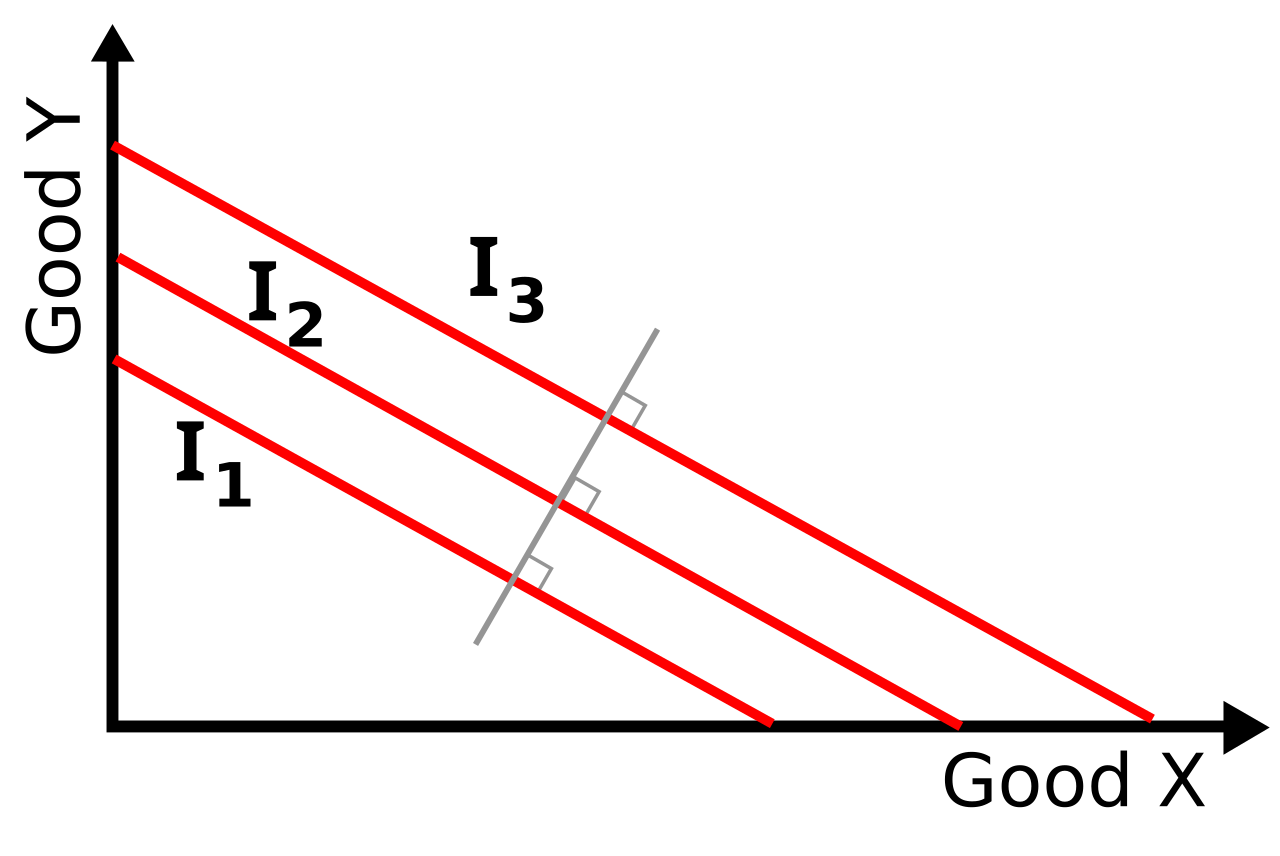
Which preferences produce straight-line indifference curves?
Perfect complements
Perfect substitutes
Cobb-Douglas
Diminishing MRS
Perfect substitutes: constant MRS, so the curves are straight lines. Perfect complements give L-shapes; Cobb-Douglas and diminishing MRS give convex curves.
Image: SilverStar at English Wikipedia, CC BY 2.5, via Wikimedia Commons.
A saver faces an interest rate of 10%. She earns $100 now and $110 next year and wants to consume nothing now. Maximum consumption next year?
$110
$200
$220
$210
She saves $100 now, which becomes $110 next year, plus her $110 income: $220. $210 forgets the interest on the saving.
