Quiz · Hard
Harder numerical questions on monopoly pricing, deadweight loss, price discrimination, Cournot and Stackelberg models and merger HHI.
Demand is , MC = 20 (no fixed cost). The deadweight loss from monopoly is:
200
800
400
1,600
Monopoly Q = 20, P = 60; competitive Q = 40, P = 20. DWL = ½ × (60 - 20) × (40 - 20) = 400. 800 is the monopoly profit, and 1,600 is the producer surplus under perfect price discrimination.
Demand is , MC = 20. The monopolist's consumer surplus at its profit-maximizing price is:
400
200
800
1,600
At Q = 20 and P = 60, CS = ½ × (100 - 60) × 20 = 400. Under competition (Q = 40, P = 20) CS would be 1,600.
Market A: , market B: , MC = 10. A third-degree price-discriminating monopolist charges:
20 in A and 30 in B
30 in both
40 in A and 20 in B
30 in A and 20 in B
MR = MC in each: A: 50 - 2Q = 10 gives Q = 20, P = 30. B: 30 - 2Q = 10 gives Q = 10, P = 20. Elasticity is 1.5 in A and 2 in B, so the less elastic market pays more.
A monopolist has MC = $12 and at the optimum. Its price is:
$12
$16
$14
$48
. The $48 multiplies by the elasticity without subtracting 1.
, MC = 10. In a Cournot duopoly, total industry profit is:
900
1,800
2,025
4,050
Each firm produces 30 at P = 40 and earns (40 - 10) × 30 = 900; total 1,800. The monopoly profit of 2,025 is higher, which is why the firms would like to collude.
, MC = 10. In a Stackelberg game the leader produces and the follower responds. Total output and price are:
Q = 60, P = 40
Q = 45, P = 55
Q = 67.5, P = 32.5
Q = 90, P = 10
Leader 45, follower (90 - 45)/2 = 22.5, so Q = 67.5 and P = 100 - 67.5 = 32.5. The output is larger than Cournot (60) because the leader commits to a high quantity.
, MC = 10. Three Cournot firms are in the market. The price is:
$32.50
$55
$40
$10
Each produces 90/4 = 22.5, so Q = 67.5 and . With two firms the price is $40, and as n grows the price falls toward MC = $10.
In a market with the cartel output (), one of two members cheats. Its best response to the other's 22.5 is:
22.5
45
67.5
33.75
. Its profit rises to about 1,139 from 1,012.5 while the other's falls, so cheating is attractive.
A merger combines firms with shares of 20% and 15% (other shares unchanged). The increase in HHI is:
35
325
600
1,225
After the merger: 35² = 1,225. Before: 20² + 15² = 625. The increase is 600 (= 2 × 20 × 15).
A natural monopoly has ATC falling and MC below ATC at the market demand. A price cap set at P = ATC leads to:
Zero economic profit with some deadweight loss compared with P = MC
Economic profit and no deadweight loss
Losses and a need for subsidy
A price below MC
Average-cost pricing (P = ATC) lets the firm break even, but since P > MC, output is below the efficient level, so deadweight loss remains. P = MC would need a subsidy.
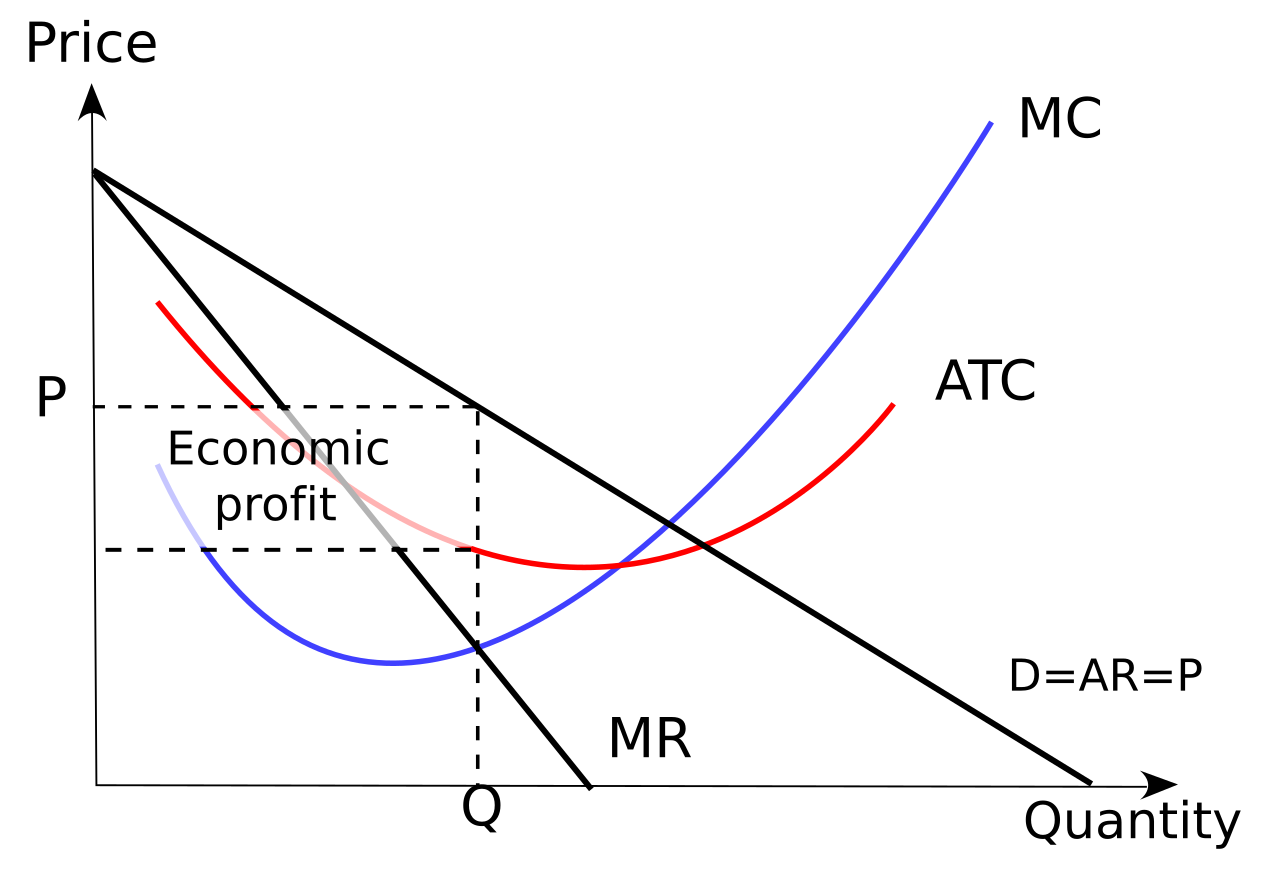
In the monopoly diagram, which curve lies below the demand curve at every positive output?
MC
ATC
AR
MR
Because the monopolist must cut price on all units to sell more, marginal revenue is less than price at every quantity.
Image: Sheitan (English Wikipedia) and Jarry1250, CC BY-SA 3.0, via Wikimedia Commons.
Under perfect price discrimination with and MC = 20, the monopolist's profit (no fixed cost) is:
800
1,600
1,200
2,000
Output rises to 40 and the firm captures the whole area between demand and MC: ½ × (100 - 20) × 40 = 1,600, twice the single-price profit of 800.
A competitive firm has TC = 50 + Q². The market price falls from $20 to $8. In the short run, with no variable cost other than Q²:
It shuts down since profit is negative
It produces 4 units and earns a loss of 34
It produces 8 units
It produces 4 units and earns a profit
MC = 2Q = 8 gives Q = 4. TR = 32, TC = 50 + 16 = 66, loss = 34. P = 8 exceeds AVC = Q = 4, so it keeps producing; shutting down would lose the whole fixed cost of 50.
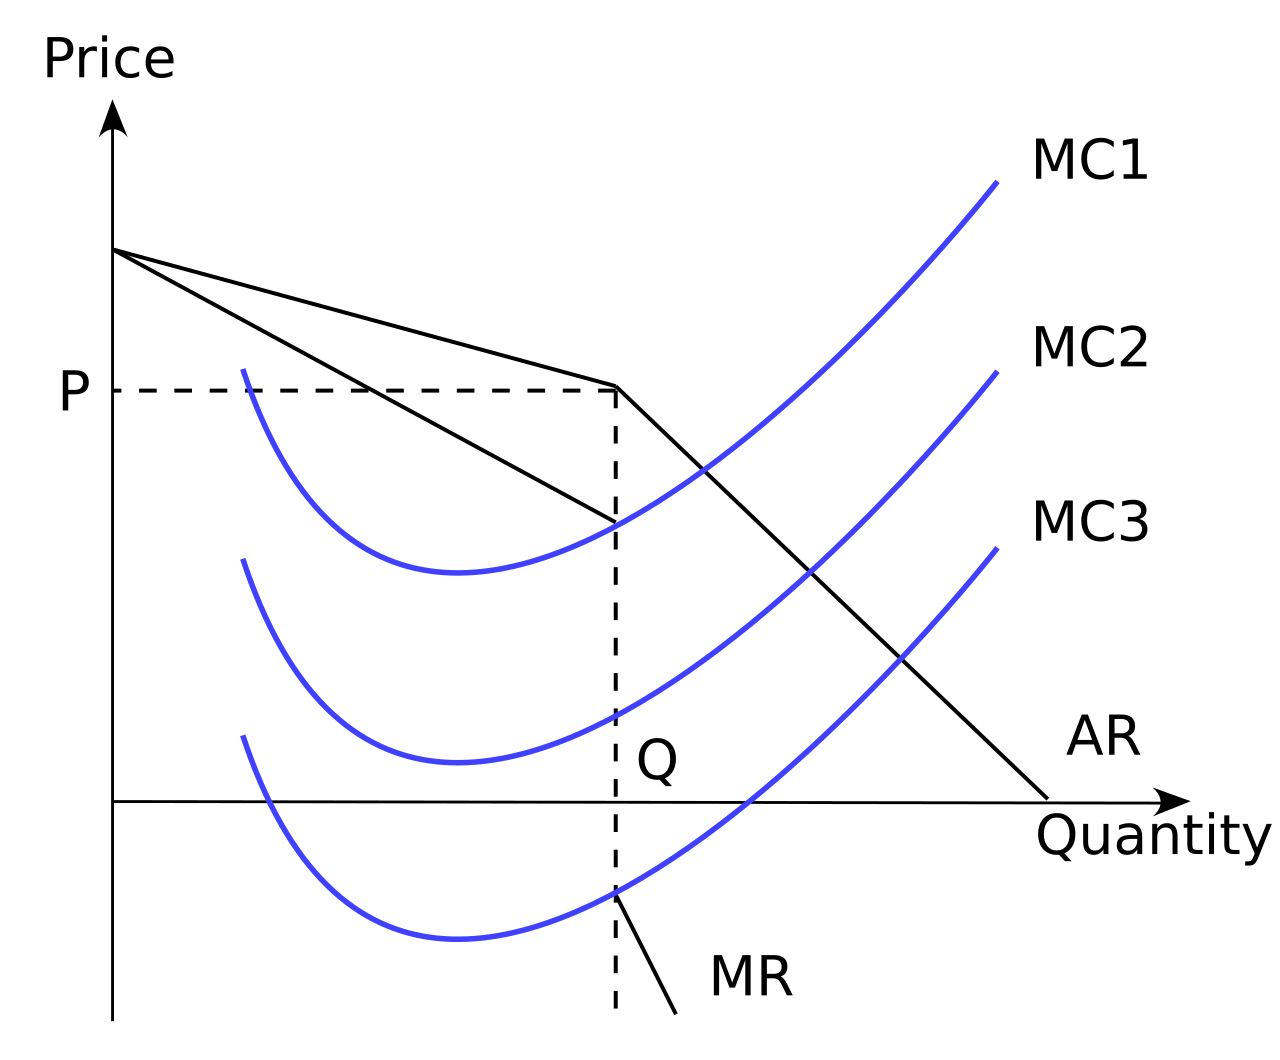
The kinked demand curve fails as a complete theory mainly because:
It predicts price wars
It assumes perfect competition
It does not explain how the price was set initially
It ignores marginal cost
The model takes the price at the kink as given, so it explains price rigidity but not the original price level.
Image: Sheitan (English Wikipedia) and Jarry1250, CC BY-SA 3.0, via Wikimedia Commons.
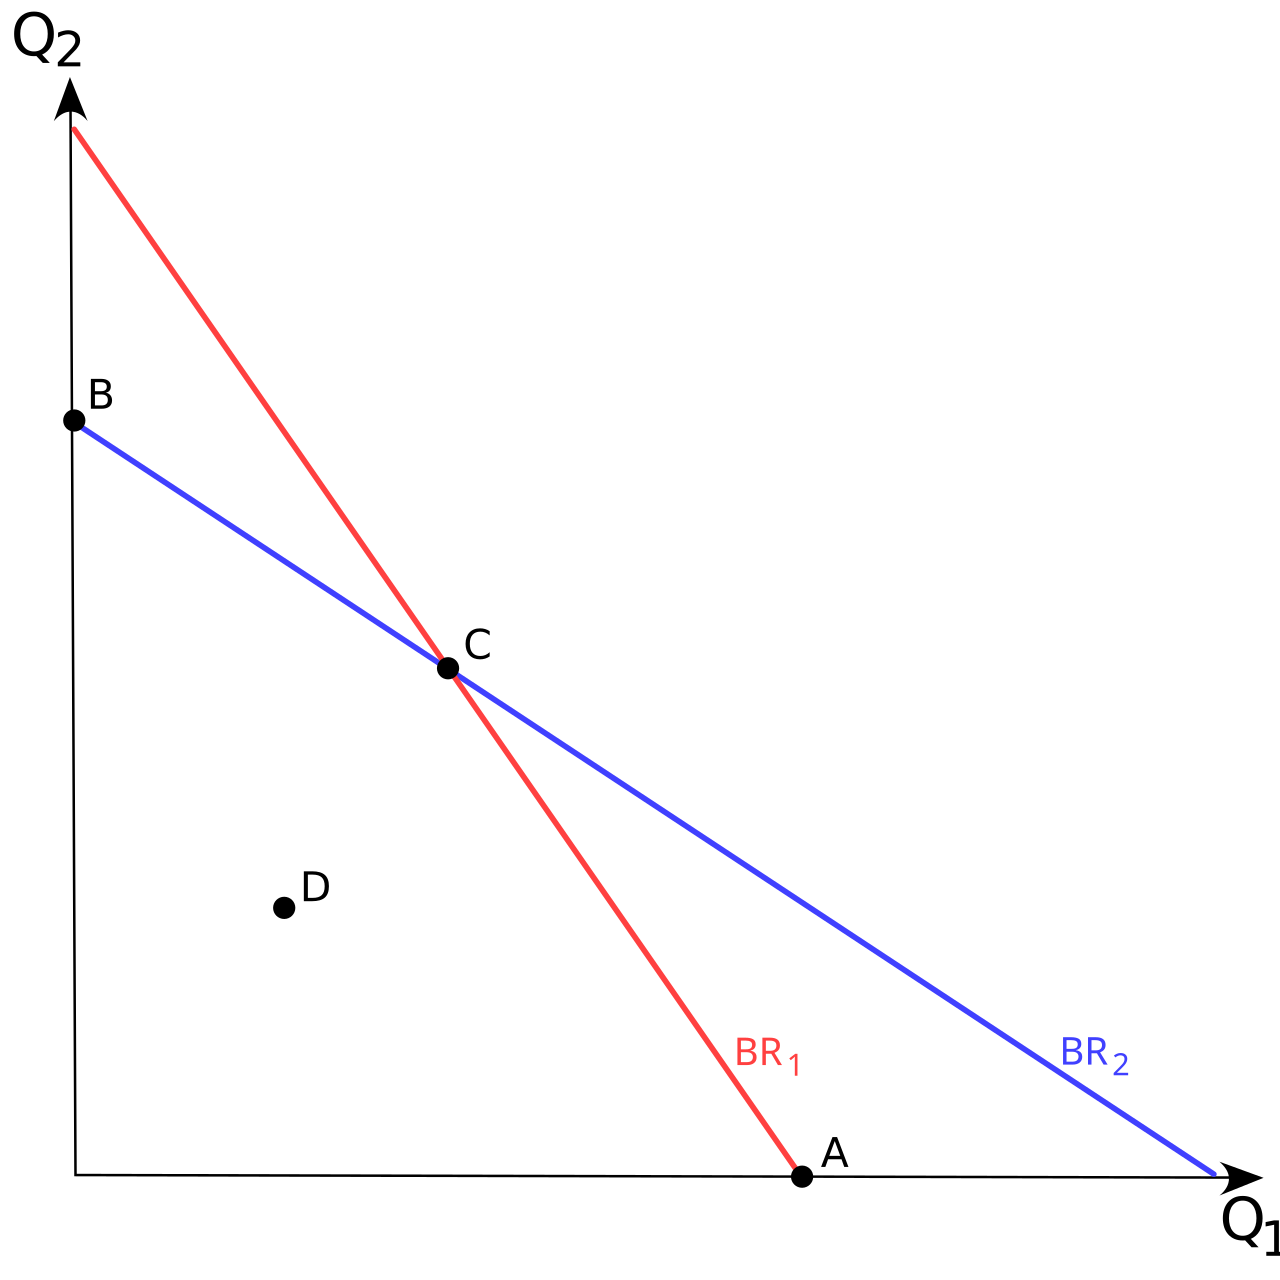
In the figure, BR1 and BR2 are the two firms' best-response curves. Which point is the Cournot-Nash equilibrium?
Point C
Point A
Point B
Point D
The Nash equilibrium is where both firms are on their best-response curves at once, which is the crossing point C. A and B are intercepts, where one firm acts as a monopolist and the other produces nothing; D is not on either curve, so at least one firm could gain by changing output.
Image: Pawel Zdziarski (faxe), Astarot, Everlong and Jarry1250, CC BY-SA 3.0, via Wikimedia Commons.
Free entry in monopolistic competition ensures that in the long run:
Firms earn positive profit
Price equals marginal cost
Firms produce at minimum ATC
Price equals average total cost
Entry continues until demand is tangent to ATC, so P = ATC and economic profit is zero. P exceeds MC and output is to the left of minimum ATC.
