Quiz · Medium
Reading scatterplots, r, slope and intercept, residuals, r-squared, outliers and extrapolation.
The least-squares line passes through the point...
(0, 0)
(median x, median y)
(x-bar, y-bar)
(x-bar, 0)
This is guaranteed by the formula for the intercept.
Which value of r indicates the strongest linear relationship?
0.60
-0.92
-0.50
0.85
Strength is measured by |r|, and 0.92 is the largest absolute value.
The correlation coefficient r must lie between...
-1 and 1
0 and 1
-100 and 100
0 and infinity
r is always in [-1, 1].
If every point in a scatterplot falls exactly on a line with negative slope, r equals...
0
-0.5
1
-1
A perfect negative linear relationship gives r = -1.
The U-shaped scatterplot with r near 0 shows that...
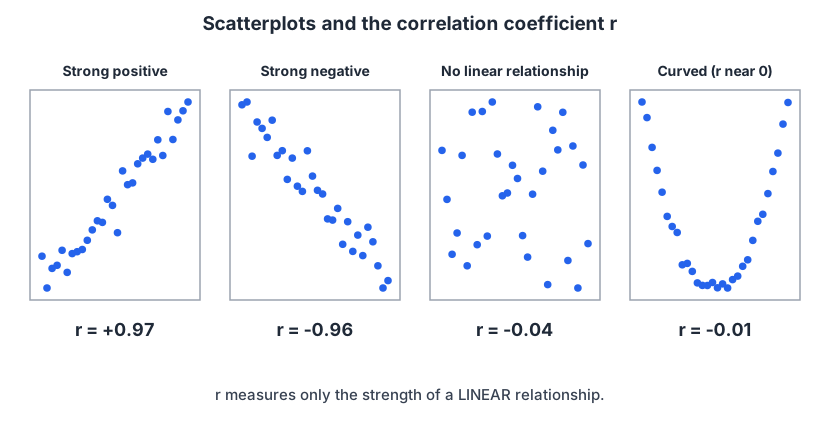
There is no relationship at all
The data have no outliers
r only measures linear association
The slope must be positive
A strong curve can have r near 0.
Which statement about r is TRUE?
r has the units of y
Changing units of x or y does not change r
r is resistant to outliers
r(x, y) differs from r(y, x)
r is unitless and symmetric but not resistant.
A regression line has slope 3.7. This means...
Each 1-unit increase in x is associated with a 3.7-unit increase in predicted y
y always increases by 3.7
x increases 3.7 for each y
The correlation is 3.7
The slope is the average change in predicted y per unit of x.
With r = 0.8, s_x = 2 and s_y = 10, the slope is...
0.16
16
0.8
4
b1 = r(sy/sx) = 0.8(5) = 4.
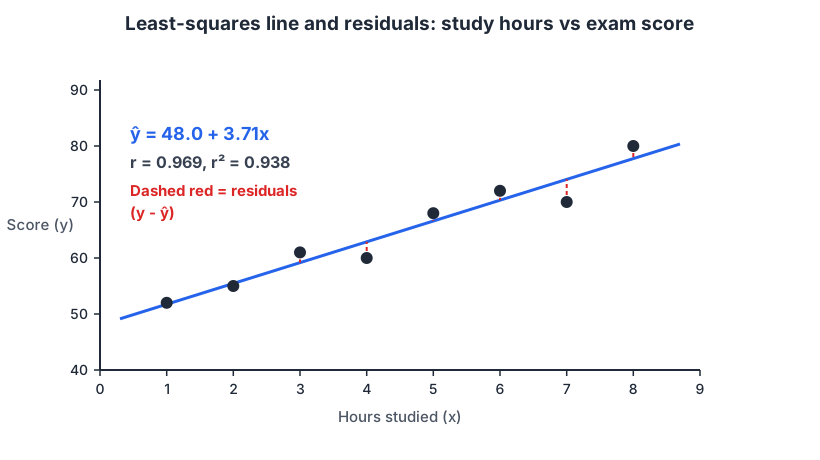
The fitted line is y-hat = 48.04 + 3.714x. The predicted score for x = 5.5 is about...
51.7
68.5
20.4
75.2
48.04 + 3.714(5.5) = 68.46.
A residual is computed as...
Observed y minus predicted y
Predicted y minus observed y
x minus x-bar
y minus y-bar
e = y - y-hat.
A student's actual score is 70 while the line predicts 74.04. The residual is...
4.04
74.04
-70
-4.04
70 - 74.04 = -4.04: the model overestimated.
The sum of the residuals for a least-squares line with an intercept is...
1
The largest residual
0
n
Residuals always balance around zero.
An r-squared of 0.81 means...
81% of points lie on the line
81% of the variation in y is explained by its linear relationship with x
The slope is 0.81
r = 0.81
r-squared is the proportion of variation explained.
If r-squared = 0.49 and the slope is negative, what is r?
-0.7
0.7
-0.49
-0.24
r = -sqrt(0.49) = -0.7; the sign follows the slope.
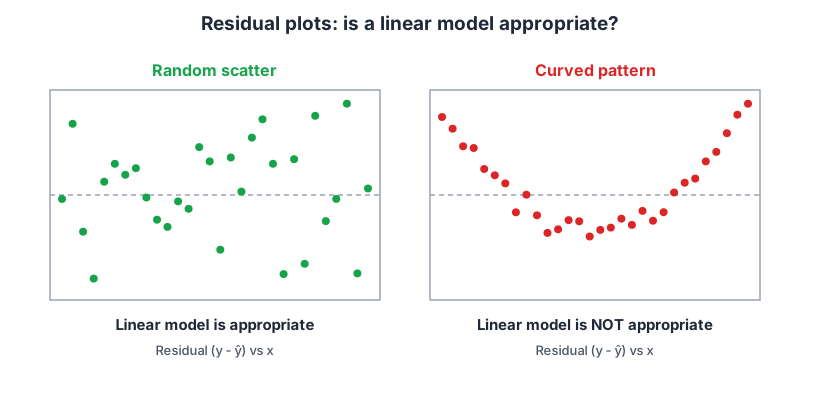
A residual plot with a clear U-shaped pattern suggests...
The model is perfect
The data are normally distributed
r must equal 1
A linear model is inappropriate
The curvature means the straight line misses the true relationship.
Predicting y for an x far outside the range of the data is called...
Interpolation
Standardization
Extrapolation
Randomization
Extrapolation is unreliable because the pattern may change.
A point far to the right of the other points, which pulls the regression line toward itself, is...
A lurking variable
A high-leverage (influential) point
A residual
An interaction
Extreme x-values have high leverage.
A strong correlation between ice-cream sales and drowning deaths is best explained by...
A lurking variable (hot weather)
Ice cream causes drowning
Drowning causes ice-cream sales
Chance only
Association is not causation; temperature drives both.
The standard deviation of residuals measures...
The slope's variability
The correlation
The sample size
The typical prediction error in the units of y
s_e summarizes how far points fall from the line.
Which is a condition for linear regression inference?
x and y both normal
The sample must include the origin
Residuals roughly normal with constant variance
r must be at least 0.5
The L-I-N-E conditions concern linearity, independence, normal residuals, equal variance.
