Flashcards
Label and interpret the key evaluation figures: confusion-matrix metrics, ROC curve, precision vs recall, bias-variance curve, k-fold cross-validation and over/underfitting.
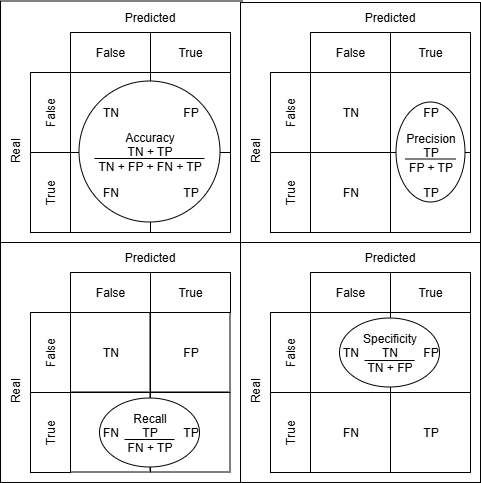
Which metric does the oval in the BOTTOM-LEFT panel of this figure describe, and what question does it answer?
Tap to flip
Recall (sensitivity, true positive rate) = TP / (TP + FN). Of all the REAL positives, how many did the model find?
Tap to see the front